Free Access
Fig. 17
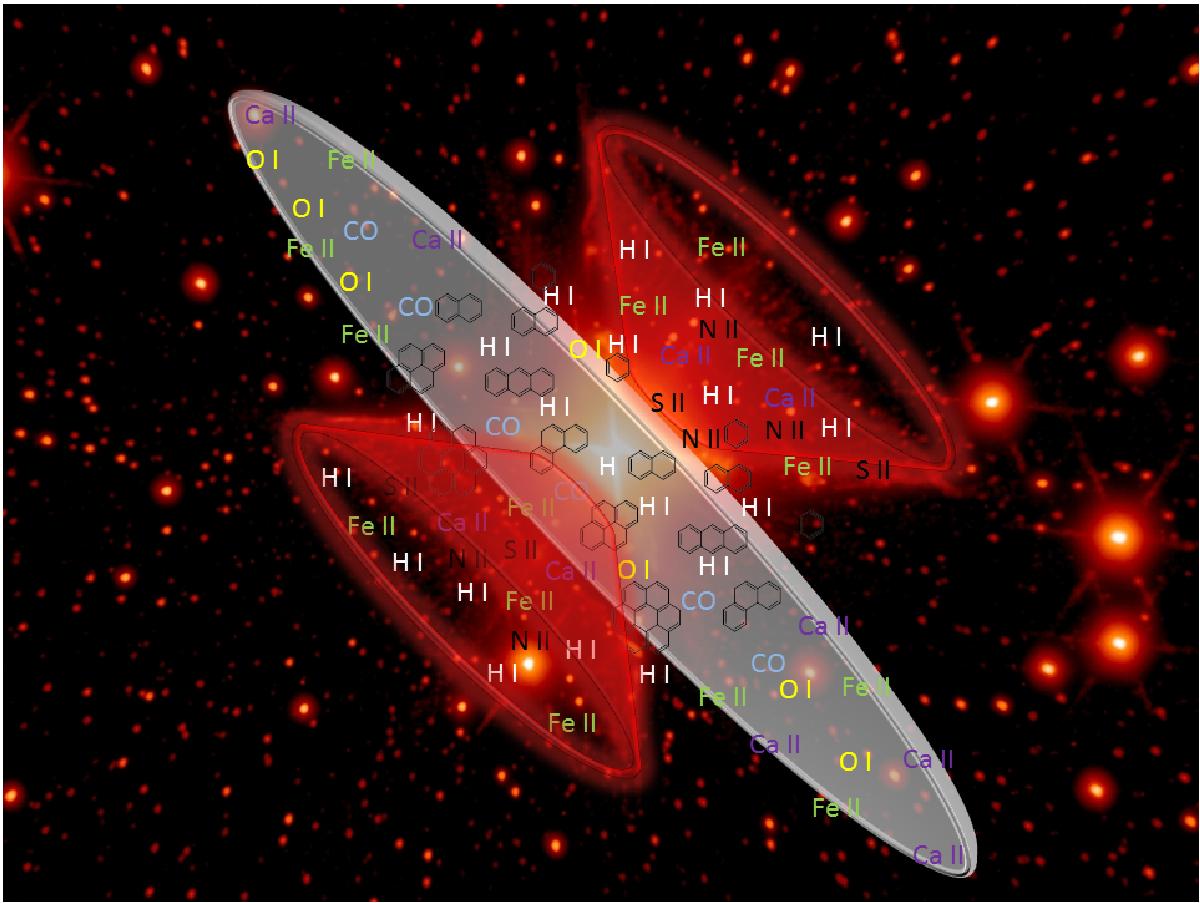
Identified emission lines are depicted schematically. The Red Square image has been taken by Tuthill & Lloyd (2007). According to our analysis we place the identified emission features according to their location in the nebula.
Current usage metrics show cumulative count of Article Views (full-text article views including HTML views, PDF and ePub downloads, according to the available data) and Abstracts Views on Vision4Press platform.
Data correspond to usage on the plateform after 2015. The current usage metrics is available 48-96 hours after online publication and is updated daily on week days.
Initial download of the metrics may take a while.