Fig. 11
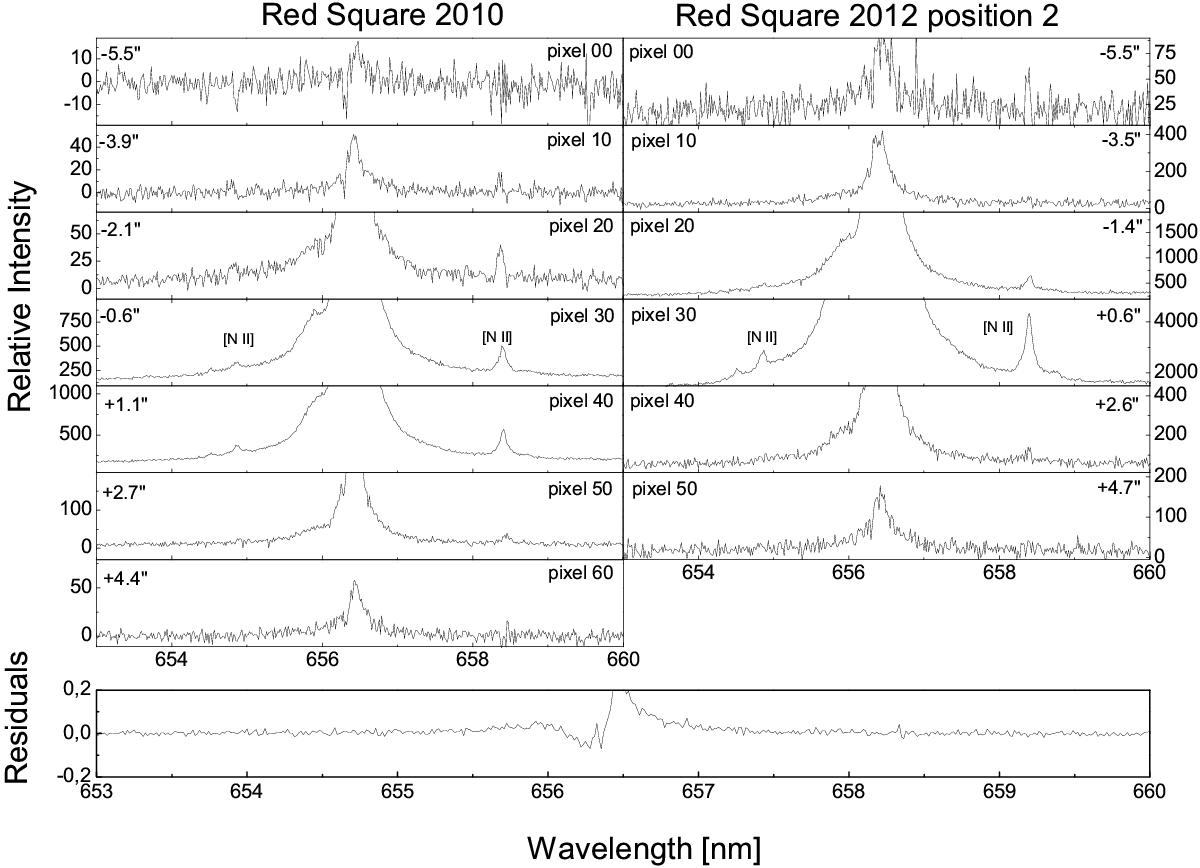
Zoom-in on the [N ii] lines located at 654.86 nm and 658.39 nm, next to the Hα line. We plot the two spectra obtained in 2010 in 2012, position 2. Pixel 00 (2010) corresponds to the south-east position. Pixel 00 for position 2 in 2012 is located in the east. The low density gas tracers can be seen in both spectra, but become very weak at the edges of the respective slit positions. However, a small absorption band can be detected at pixel 00, in the 2010 dataset. This is indicating that the forbidden N ii can be seen close to the central star in emission (pixel 30, 2010 dataset), and further away from the central star in absorption (pixel 00, 2010 dataset). The bottom-most panel gives the residuals of the slit spectrum in 2012 (position 2) when the spectrum at +0.6′′ (pixel 30) is subtracted from the spectrum at −2.5′′ (pixel 15) distance to the central star. Negative distances indicate directions in the south-(east) of the nebula. Positive distances indicate directions towards the north-(west).
Current usage metrics show cumulative count of Article Views (full-text article views including HTML views, PDF and ePub downloads, according to the available data) and Abstracts Views on Vision4Press platform.
Data correspond to usage on the plateform after 2015. The current usage metrics is available 48-96 hours after online publication and is updated daily on week days.
Initial download of the metrics may take a while.