Fig. 8
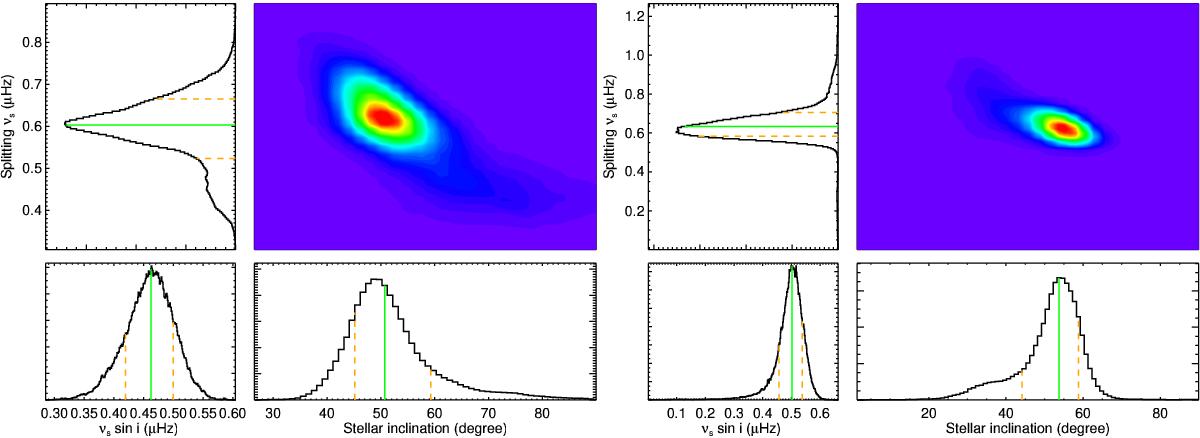
Posterior distribution of the frequency splitting as a function of inclination angle for HD 176465 A (left) and B (right). The marginalised distributions for the splitting and inclination angle are shown in the histograms along each axis. The distributions for vssini are shown in the lower-left corners. The solid green lines indicate the median value of the distributions, while the dashed orange lines indicate the 68% confidence intervals.
Current usage metrics show cumulative count of Article Views (full-text article views including HTML views, PDF and ePub downloads, according to the available data) and Abstracts Views on Vision4Press platform.
Data correspond to usage on the plateform after 2015. The current usage metrics is available 48-96 hours after online publication and is updated daily on week days.
Initial download of the metrics may take a while.