Fig. 3
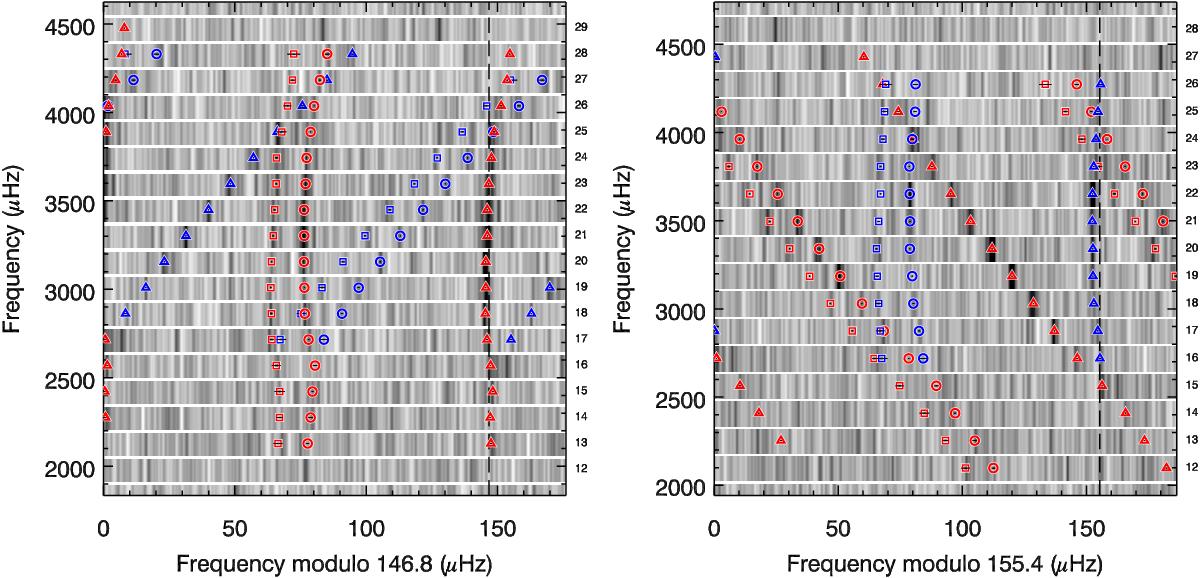
Échelle diagrams of HD 176465 A (left) and B (right) showing the overlapping sets of modes with different large separations. The fitted frequencies are indicated by the red and blue symbols for the A and B components respectively. Symbol shapes indicate the mode identification: circles are l = 0 modes, triangles are l = 1 modes, and squares are l = 2 modes. For reference, a greyscale map of the smoothed power spectrum is shown in the background. Numbers to the right of the plot indicate radial order of the l = 0 modes. To make the location of modes near the edge of the échelle diagrams clearer, the diagrams have been extended in width beyond the value of the large separation, which is indicated by the dashed vertical lines. The peak at 4531 μHz is the 8th harmonic of the Kepler long-cadence sampling rate, which is a known artifact (Gilliland et al. 2010b).
Current usage metrics show cumulative count of Article Views (full-text article views including HTML views, PDF and ePub downloads, according to the available data) and Abstracts Views on Vision4Press platform.
Data correspond to usage on the plateform after 2015. The current usage metrics is available 48-96 hours after online publication and is updated daily on week days.
Initial download of the metrics may take a while.