Fig. 2
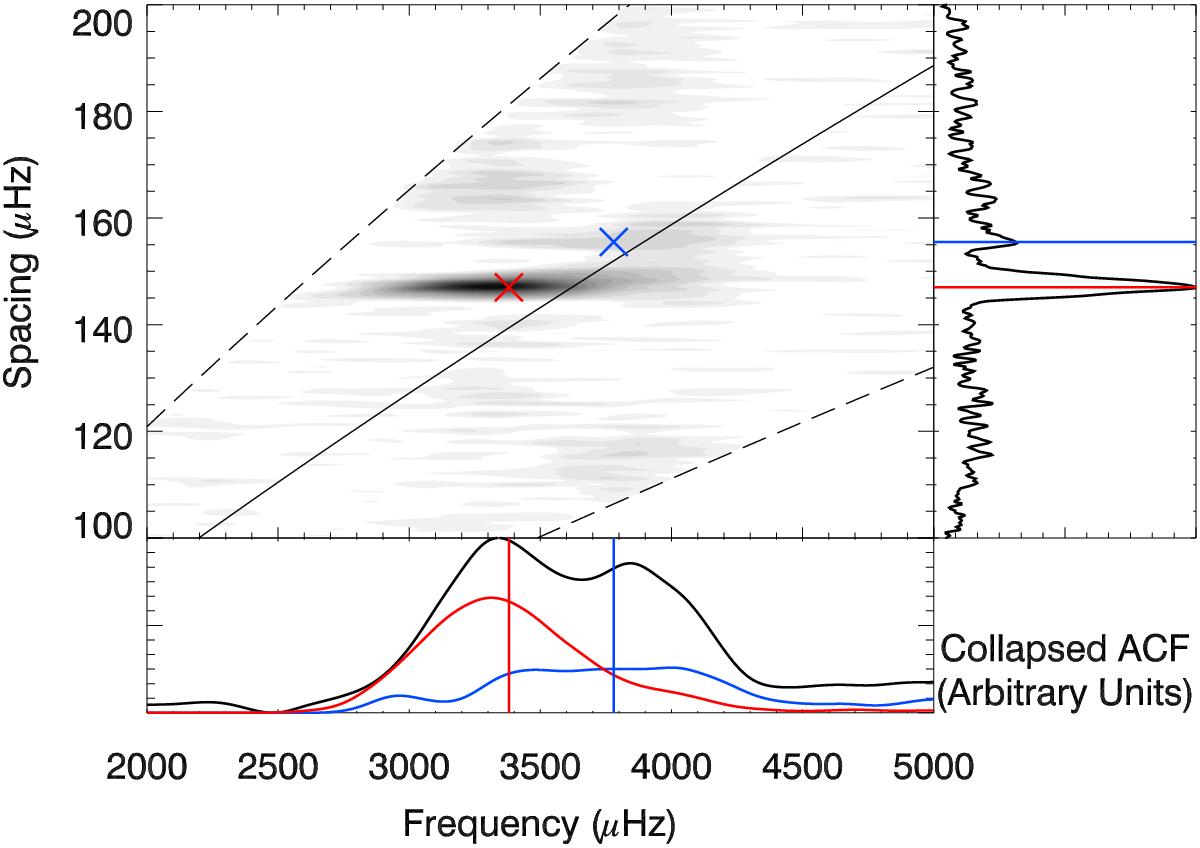
Localised autocorrelation of the power spectrum of HD 176465. Two peaks in the autocorrelation function are visible, corresponding to the primary and secondary components of HD 176465 (red and blue crosses, respectively). The solid line shows the mean observed relation between Δν and νmax (Stello et al. 2009), while the dashed lines are 0.7 and 1.3 times this value. The collapsed autocorrelation function (ACF) along each axis are shown in black in the lower and right panels, with the peaks indicated by red and blue lines. The red and blue curves in the lower panel show the collapsed ACF with spacings around 147 and 155 μHz, respectively.
Current usage metrics show cumulative count of Article Views (full-text article views including HTML views, PDF and ePub downloads, according to the available data) and Abstracts Views on Vision4Press platform.
Data correspond to usage on the plateform after 2015. The current usage metrics is available 48-96 hours after online publication and is updated daily on week days.
Initial download of the metrics may take a while.