Fig. 9
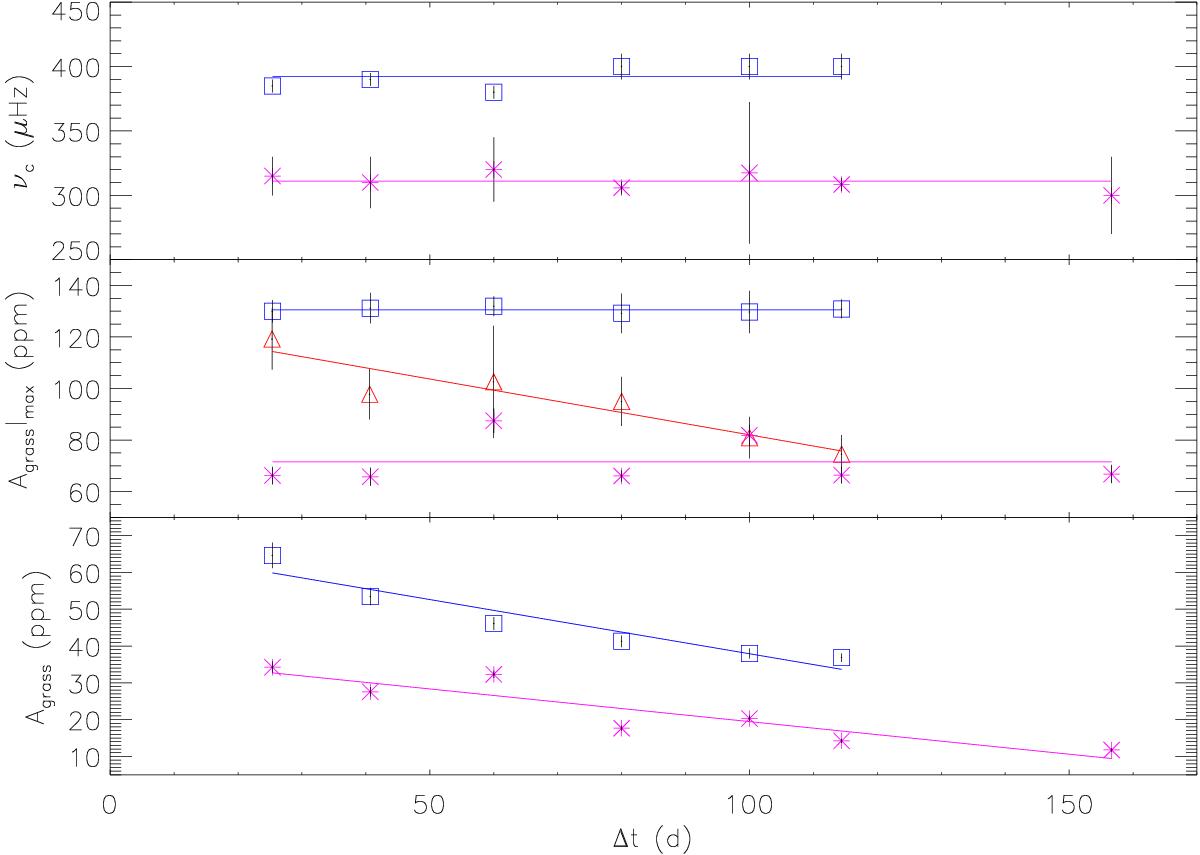
Cut-off frequency (top), maximum amplitude (middle), and mean amplitude of the grass (bottom panel) versus duration of the studied light curve for CID 546 (blue squares), and CID 8669 (purple asterisks). The cut-off frequency of KIC 5892969’s power spectrum is not visible therefore only the maximum amplitude of the grass can be properly calculated (red triangles). Each line is the linear fit to the observed data points. The mean amplitude of the grass for CID 546 has been increased by 20 ppm to properly observe its behaviour.
Current usage metrics show cumulative count of Article Views (full-text article views including HTML views, PDF and ePub downloads, according to the available data) and Abstracts Views on Vision4Press platform.
Data correspond to usage on the plateform after 2015. The current usage metrics is available 48-96 hours after online publication and is updated daily on week days.
Initial download of the metrics may take a while.