Fig. 7
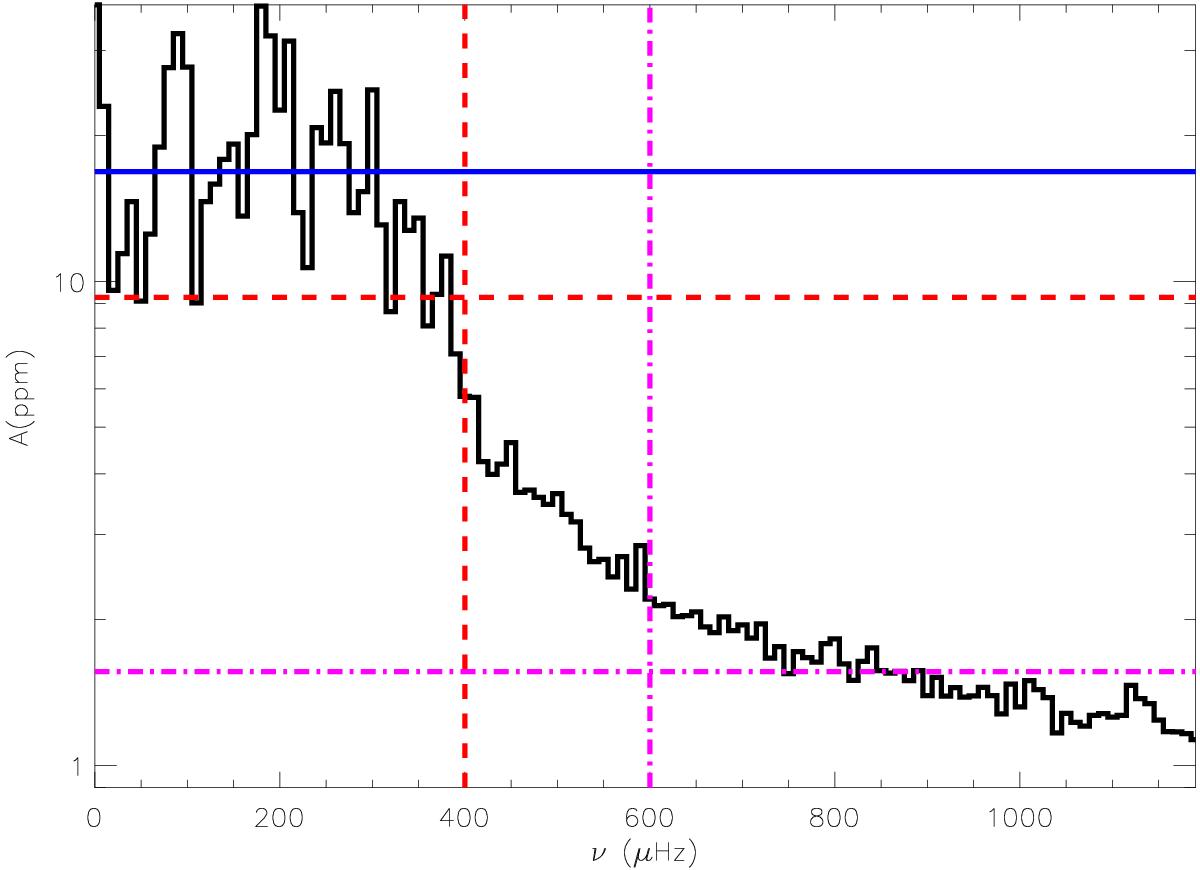
Mean amplitude per bin of 10 μHz of the CID 546 power spectrum after extraction of the peaks considered as envelope. The blue solid line indicates the grass level, and the red dashed lines indicate the cut-off frequency and its amplitude level. The purple dashed-dotted lines indicate the noise frequency and the mean amplitude of noise.
Current usage metrics show cumulative count of Article Views (full-text article views including HTML views, PDF and ePub downloads, according to the available data) and Abstracts Views on Vision4Press platform.
Data correspond to usage on the plateform after 2015. The current usage metrics is available 48-96 hours after online publication and is updated daily on week days.
Initial download of the metrics may take a while.