Free Access
Fig. 1
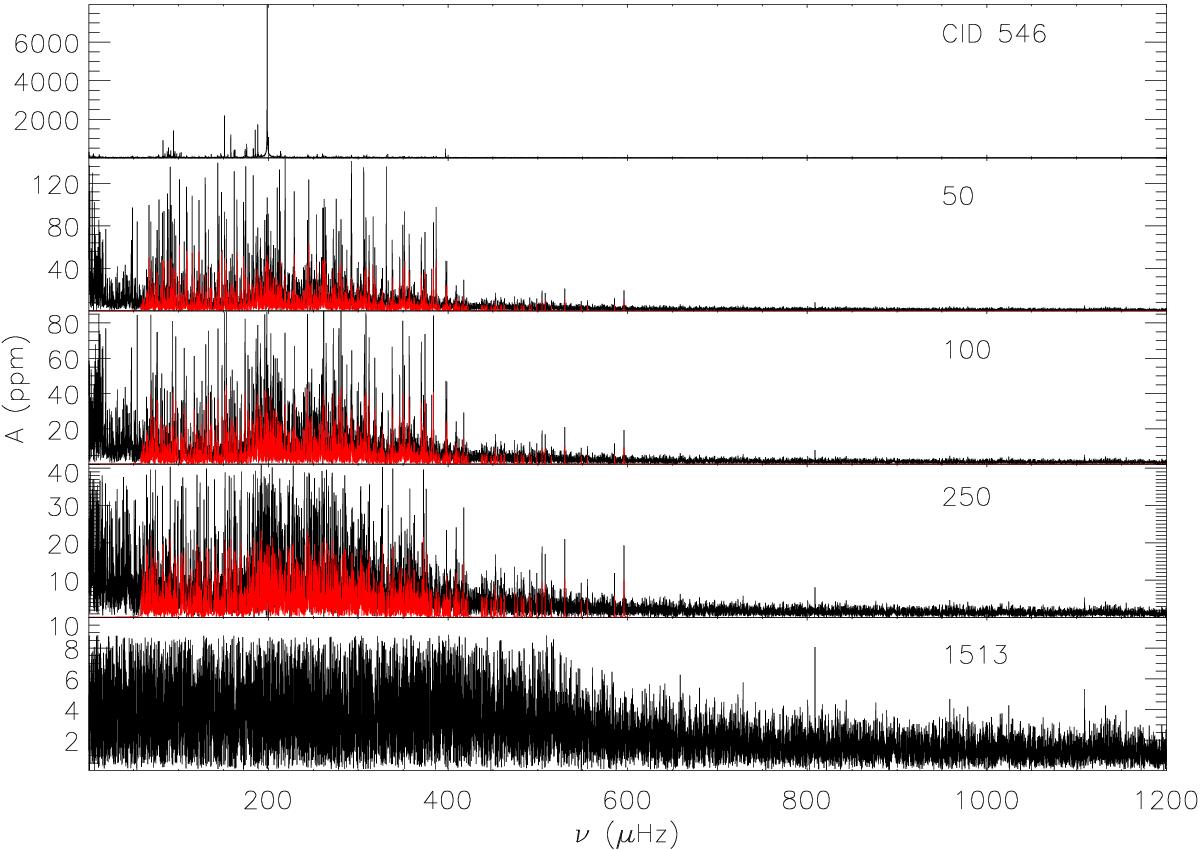
From top to bottom: Power-spectral structure of the original light curve for CID 546, and also those after extracting the indicated number of peaks. The contribution of the peaks considered as “grass” is represented in red (see Sect. 6).
Current usage metrics show cumulative count of Article Views (full-text article views including HTML views, PDF and ePub downloads, according to the available data) and Abstracts Views on Vision4Press platform.
Data correspond to usage on the plateform after 2015. The current usage metrics is available 48-96 hours after online publication and is updated daily on week days.
Initial download of the metrics may take a while.