Free Access
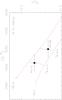
Fig. 9
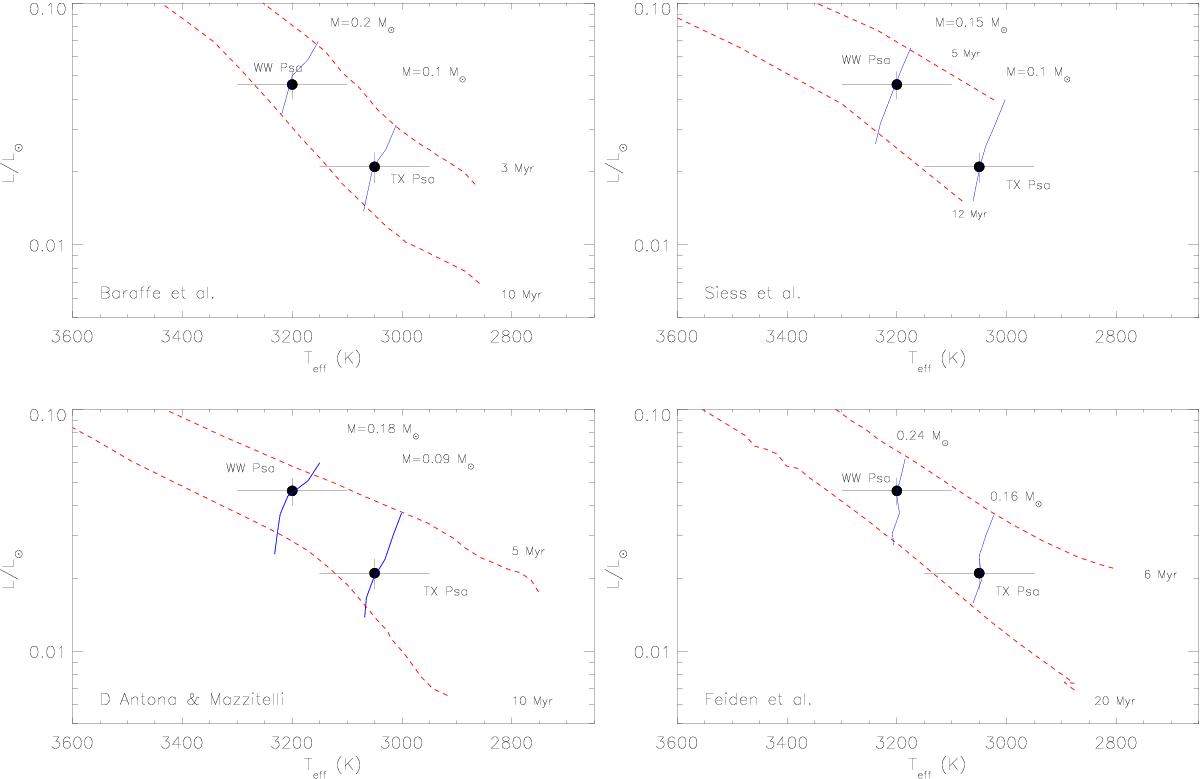
The HR diagrams. Dashed lines are isochrones whereas blue solid lines are the evolutionary tracks. Models are from Baraffe et al. (2015) (top left panel), Siess et al. (2000) (top right panel), D’Antona & Mazzitelli (1997) (bottom left panel), and Feiden et al. (2016) (bottom right panel).
This figure is made of several images, please see below:
Current usage metrics show cumulative count of Article Views (full-text article views including HTML views, PDF and ePub downloads, according to the available data) and Abstracts Views on Vision4Press platform.
Data correspond to usage on the plateform after 2015. The current usage metrics is available 48-96 hours after online publication and is updated daily on week days.
Initial download of the metrics may take a while.