Free Access
Fig. 7
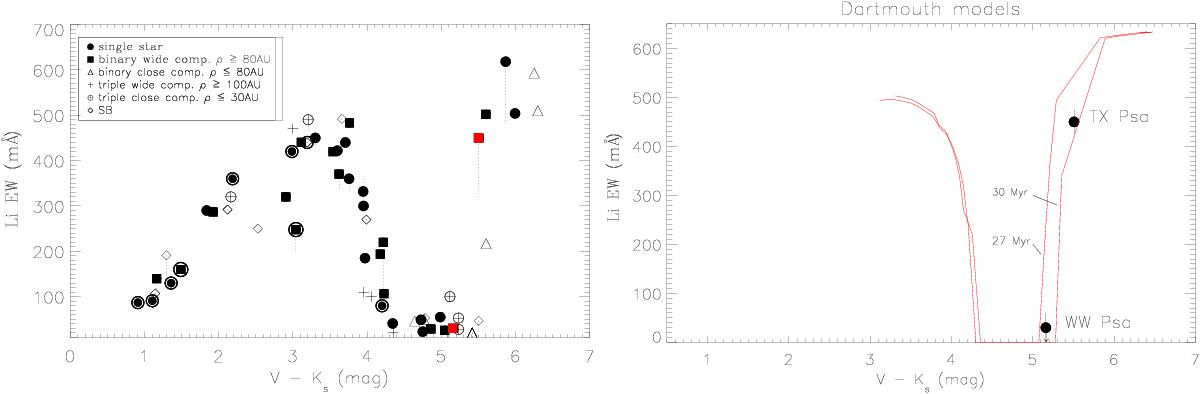
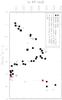
Left panel: distribution of Li EW among members of the β Pictoris association with WW Psa and TX Psa marked in red. Right panel: Li EWs for WW Psa and TX Psa with Li depletion models (solid lines) taken from Feiden (2016) corresponding to the ages of 27 Myr and 30 Myr.
This figure is made of several images, please see below:
Current usage metrics show cumulative count of Article Views (full-text article views including HTML views, PDF and ePub downloads, according to the available data) and Abstracts Views on Vision4Press platform.
Data correspond to usage on the plateform after 2015. The current usage metrics is available 48-96 hours after online publication and is updated daily on week days.
Initial download of the metrics may take a while.