Free Access
Fig. 10
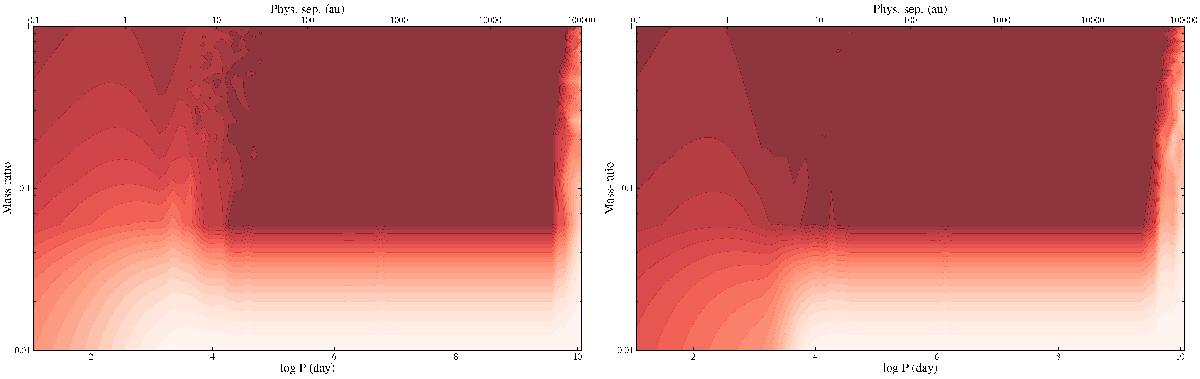
Companion detection probabilities (contours from red (100%), to white (0%), in 5% color levels) for WW Psa (left) and TX Psa (right) with mass ratio versus orbital period (day)/physical separation (AU). We note that both x- and y-scales are logarithmic.
This figure is made of several images, please see below:
Current usage metrics show cumulative count of Article Views (full-text article views including HTML views, PDF and ePub downloads, according to the available data) and Abstracts Views on Vision4Press platform.
Data correspond to usage on the plateform after 2015. The current usage metrics is available 48-96 hours after online publication and is updated daily on week days.
Initial download of the metrics may take a while.