Fig. 1
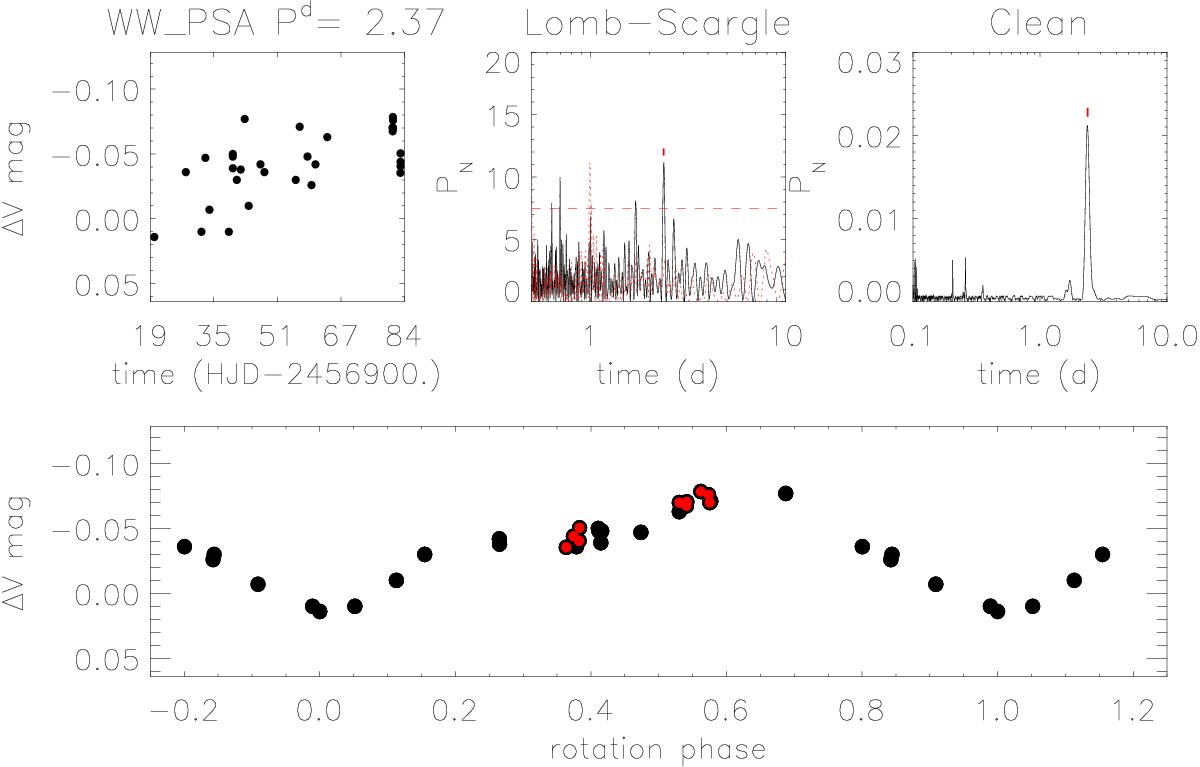
Top-left panel: V-band magnitude timeseries of WW Psa versus heliocentric Julian day collected at Siding Spring Observatory and CASLEO. Top-middle panel: Lomb-Scargle periodogram (solid line). The power peak corresponding to the rotation period P = 2.37 d is marked with a small red line above it. The dotted red line indicates the window spectral function, whereas the horizontal dashed line represents the power level corresponding to a FAP = 0.01. Top-right panel: clean periodogram. Bottom panel: light curve phased with the rotation period. Red bullets are data from CASLEO. The uncertainty associated with each point is smaller than the symbol size.
Current usage metrics show cumulative count of Article Views (full-text article views including HTML views, PDF and ePub downloads, according to the available data) and Abstracts Views on Vision4Press platform.
Data correspond to usage on the plateform after 2015. The current usage metrics is available 48-96 hours after online publication and is updated daily on week days.
Initial download of the metrics may take a while.