Fig. 9
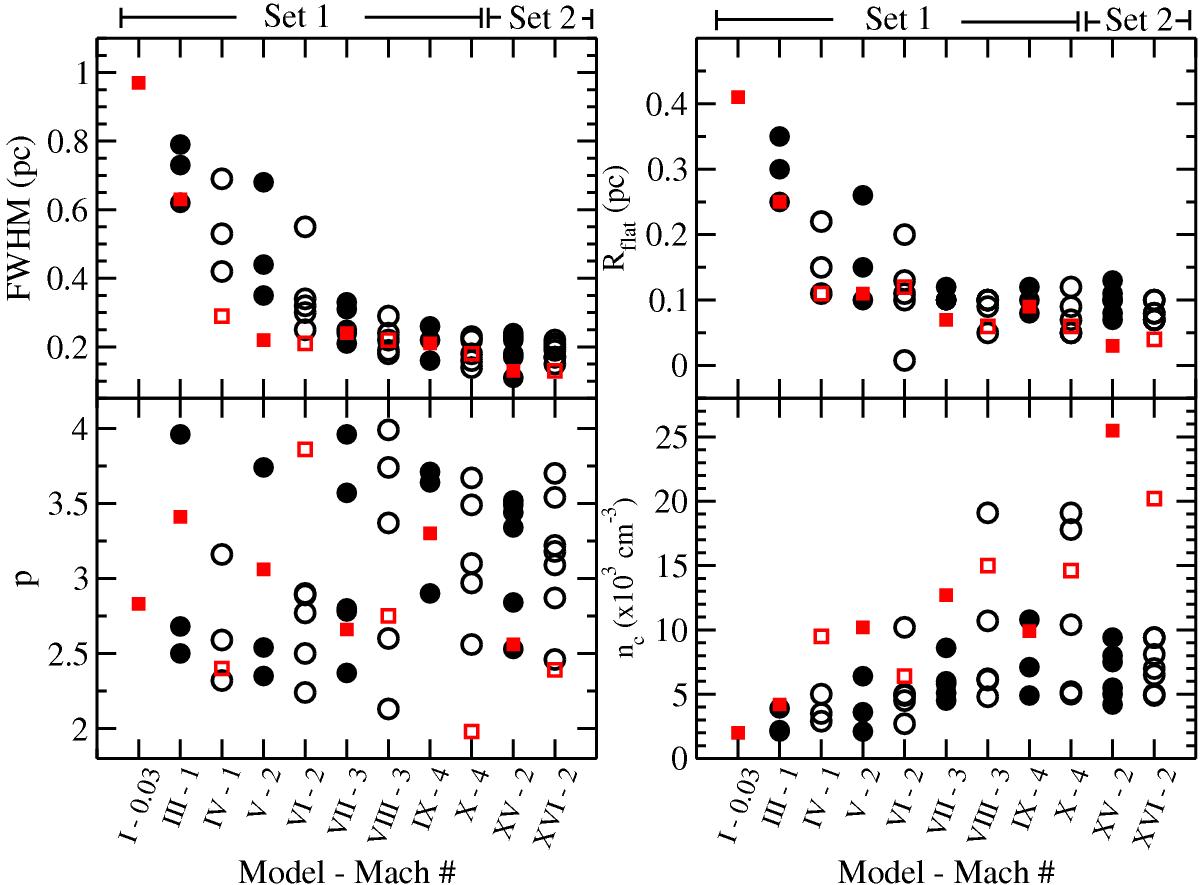
Fitted values as a function of model for both Gaussian and Plummer profiles. Red squares denote the filaments which contain the densest region which stopped the simulations. Closed symbols depict SL models while open symbols depict CR- only models. X-axis labels indicate the model number (roman numerals) and associated Mach number. Top left: Gaussian FWHM. Bottom left: Plummer p parameter. Top right: Plummer Rflat parameter. Bottom right: central filament density as calculated through Plummer profile. Recall that the resolution limit for the models is 0.0296 pc (1 pixel).
Current usage metrics show cumulative count of Article Views (full-text article views including HTML views, PDF and ePub downloads, according to the available data) and Abstracts Views on Vision4Press platform.
Data correspond to usage on the plateform after 2015. The current usage metrics is available 48-96 hours after online publication and is updated daily on week days.
Initial download of the metrics may take a while.