Fig. 7
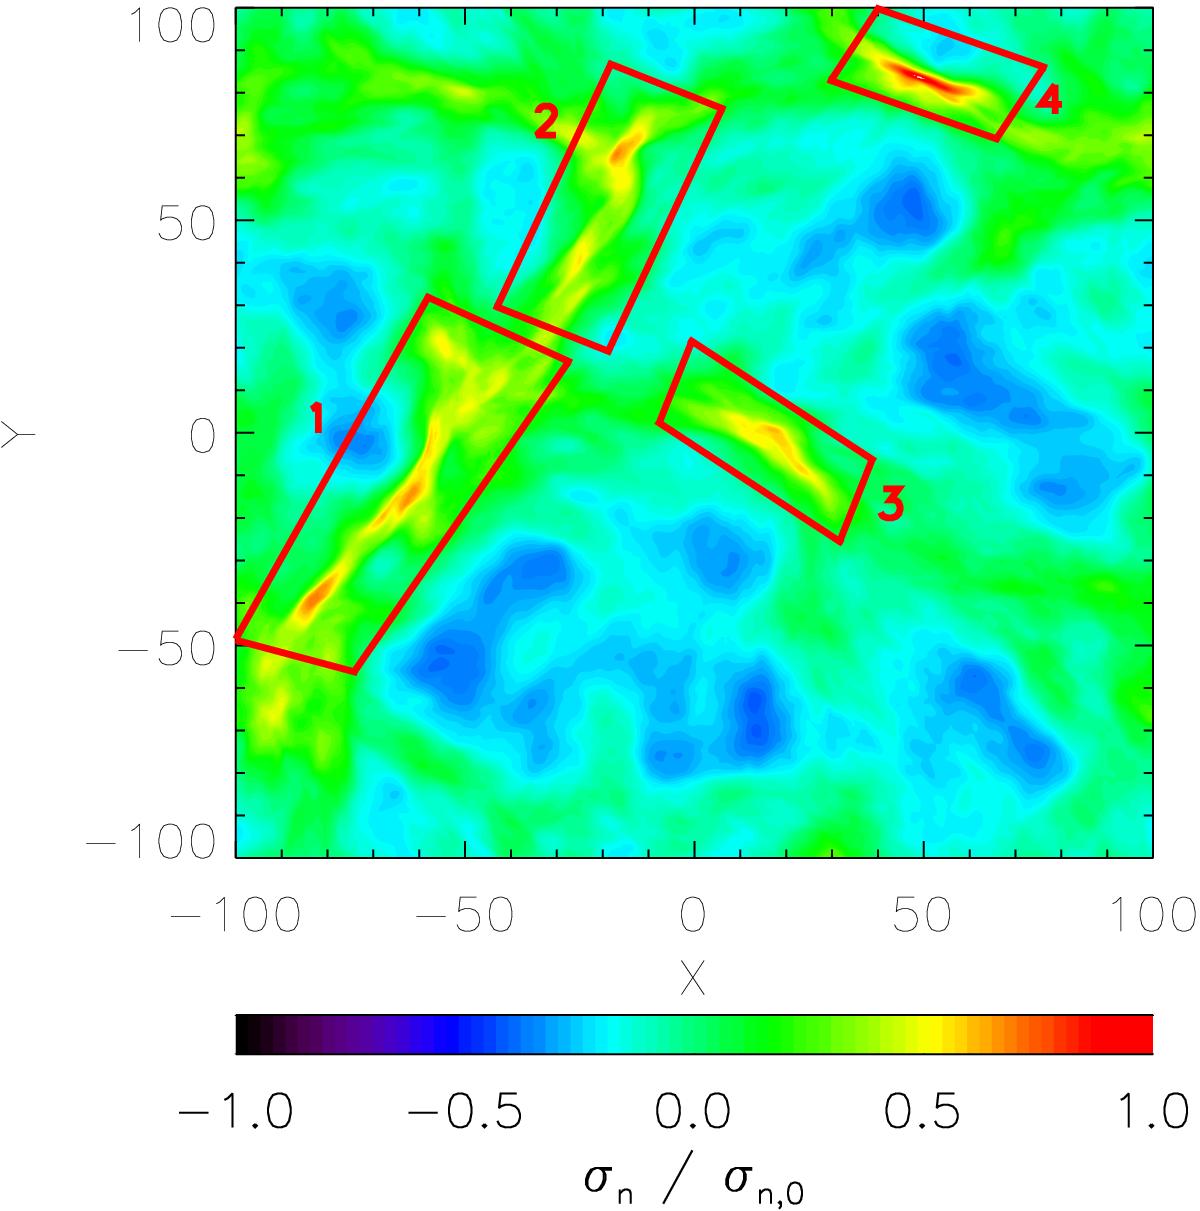
Representative map based on Model V showing the definition of filament regions. Note that this map is shifted by 50 pixels (20 map units) in the x direction compared to those in Fig. 1 to ensure that the filaments contained within region 1 are not split at the periodic boundary. To avoid confusion, all quoted locations of structures will be based upon the original locations in Fig. 1.
Current usage metrics show cumulative count of Article Views (full-text article views including HTML views, PDF and ePub downloads, according to the available data) and Abstracts Views on Vision4Press platform.
Data correspond to usage on the plateform after 2015. The current usage metrics is available 48-96 hours after online publication and is updated daily on week days.
Initial download of the metrics may take a while.