Fig. 4
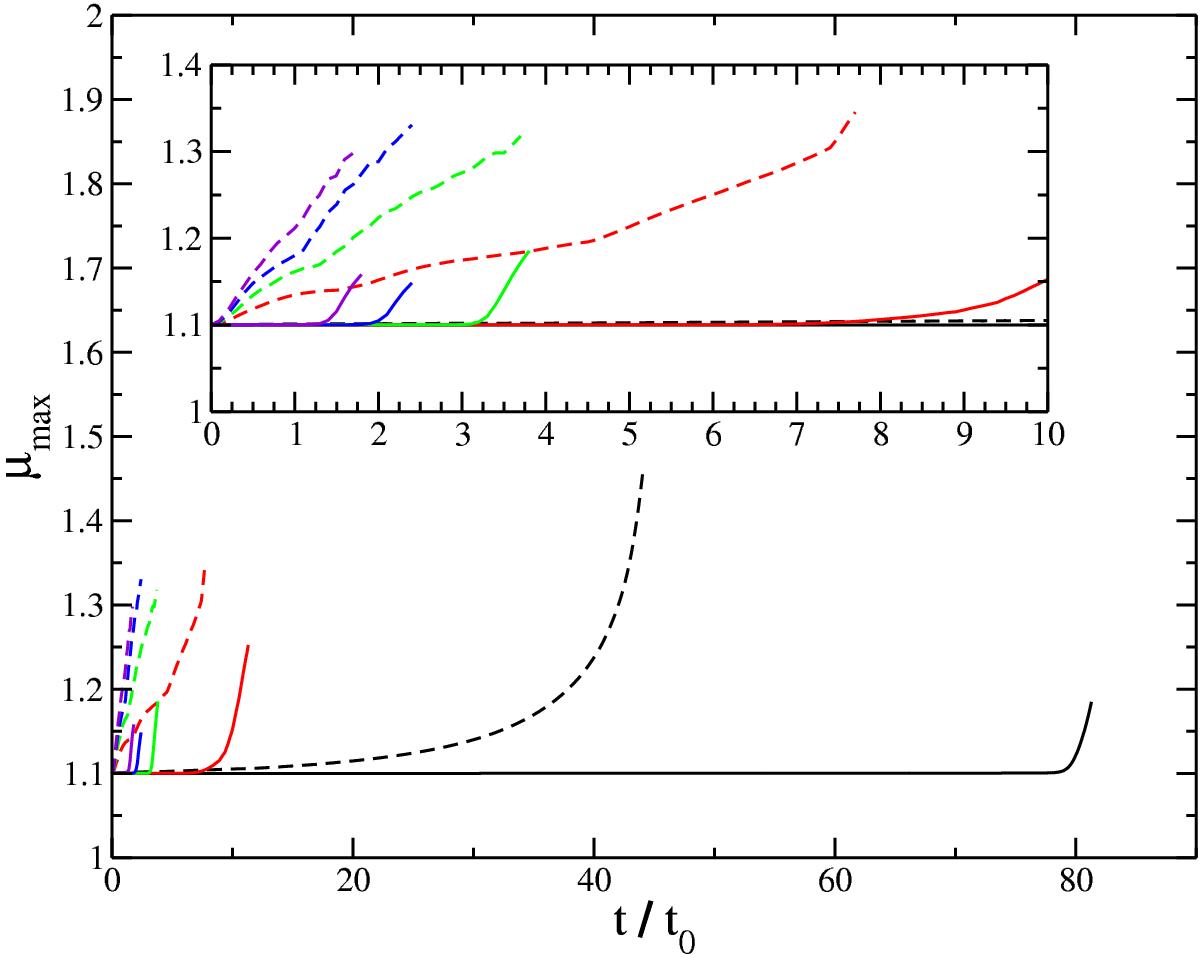
Maximum mass-to-flux ratio as a function of dimensionless time (t/t0) for all models. Solid lines indicate simulations with SL ionisation profiles while dashed lines indicate CR-only ionisation profiles. Colours indicate different Mach values (Black = 0.03, Red = 1, Green = 2, Blue = 3, and Purple = 4). The main plot shows the full time range while the inset zooms in on the range from 0 to 10t0.
Current usage metrics show cumulative count of Article Views (full-text article views including HTML views, PDF and ePub downloads, according to the available data) and Abstracts Views on Vision4Press platform.
Data correspond to usage on the plateform after 2015. The current usage metrics is available 48-96 hours after online publication and is updated daily on week days.
Initial download of the metrics may take a while.