Fig. A.2
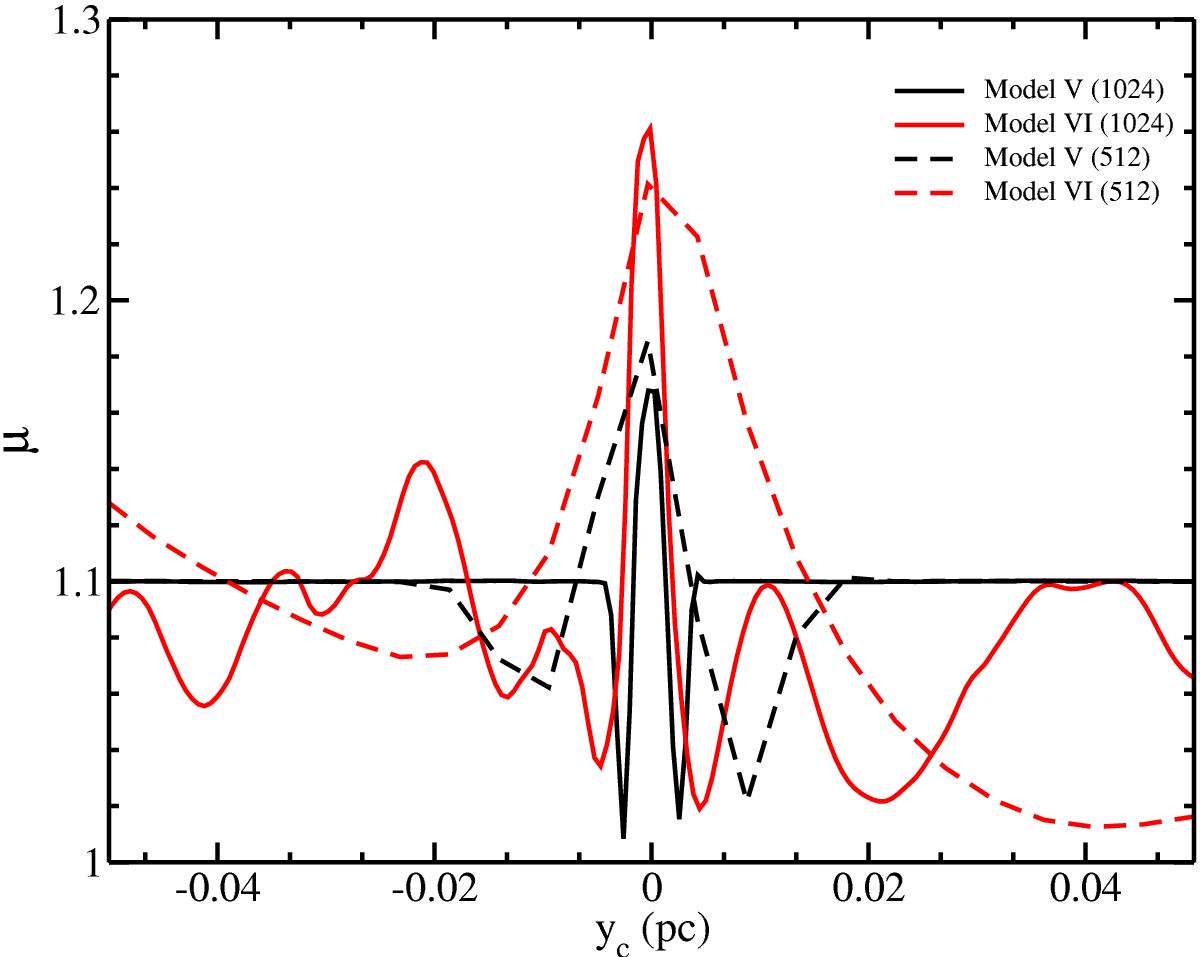
Mass-to-flux ratio profiles for the densest cores in the high (solid lines) and low (dashed lines) resolution cases. The black curves depict the SL simulations while the red curves depict the CR simulations. All profiles have been shifted such that the peaks coincide at y = 0. The x axis depicts the distance from this central peak in parsecs.
Current usage metrics show cumulative count of Article Views (full-text article views including HTML views, PDF and ePub downloads, according to the available data) and Abstracts Views on Vision4Press platform.
Data correspond to usage on the plateform after 2015. The current usage metrics is available 48-96 hours after online publication and is updated daily on week days.
Initial download of the metrics may take a while.