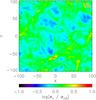
Fig. A.1
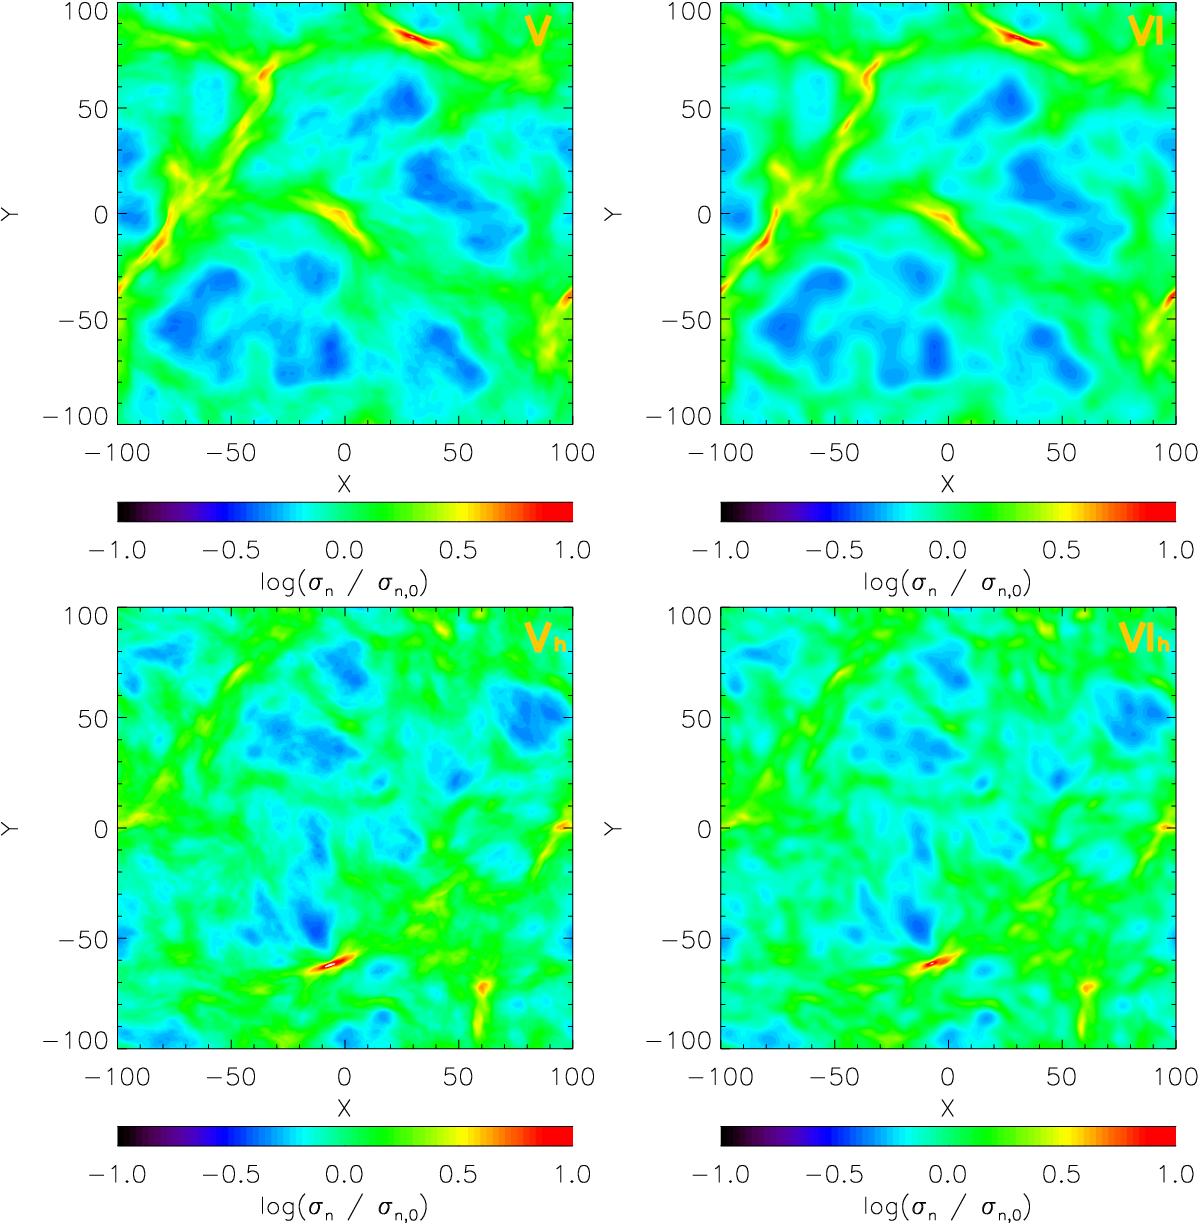
Column density enhancement maps for high and low resolution simulations of both Step-like (SL, Model V; left column) and CR-only (CR, Model VI; right column) models. High resolution models are 1024 × 1024 pixels while low resolution models are 512 × 512 pixels. Colour bar shows the logarithm of the density enhancement. Roman numerals in the top right of each panel indicate the model number while the subscript h indicates high resolution models.
Current usage metrics show cumulative count of Article Views (full-text article views including HTML views, PDF and ePub downloads, according to the available data) and Abstracts Views on Vision4Press platform.
Data correspond to usage on the plateform after 2015. The current usage metrics is available 48-96 hours after online publication and is updated daily on week days.
Initial download of the metrics may take a while.