Fig. 8
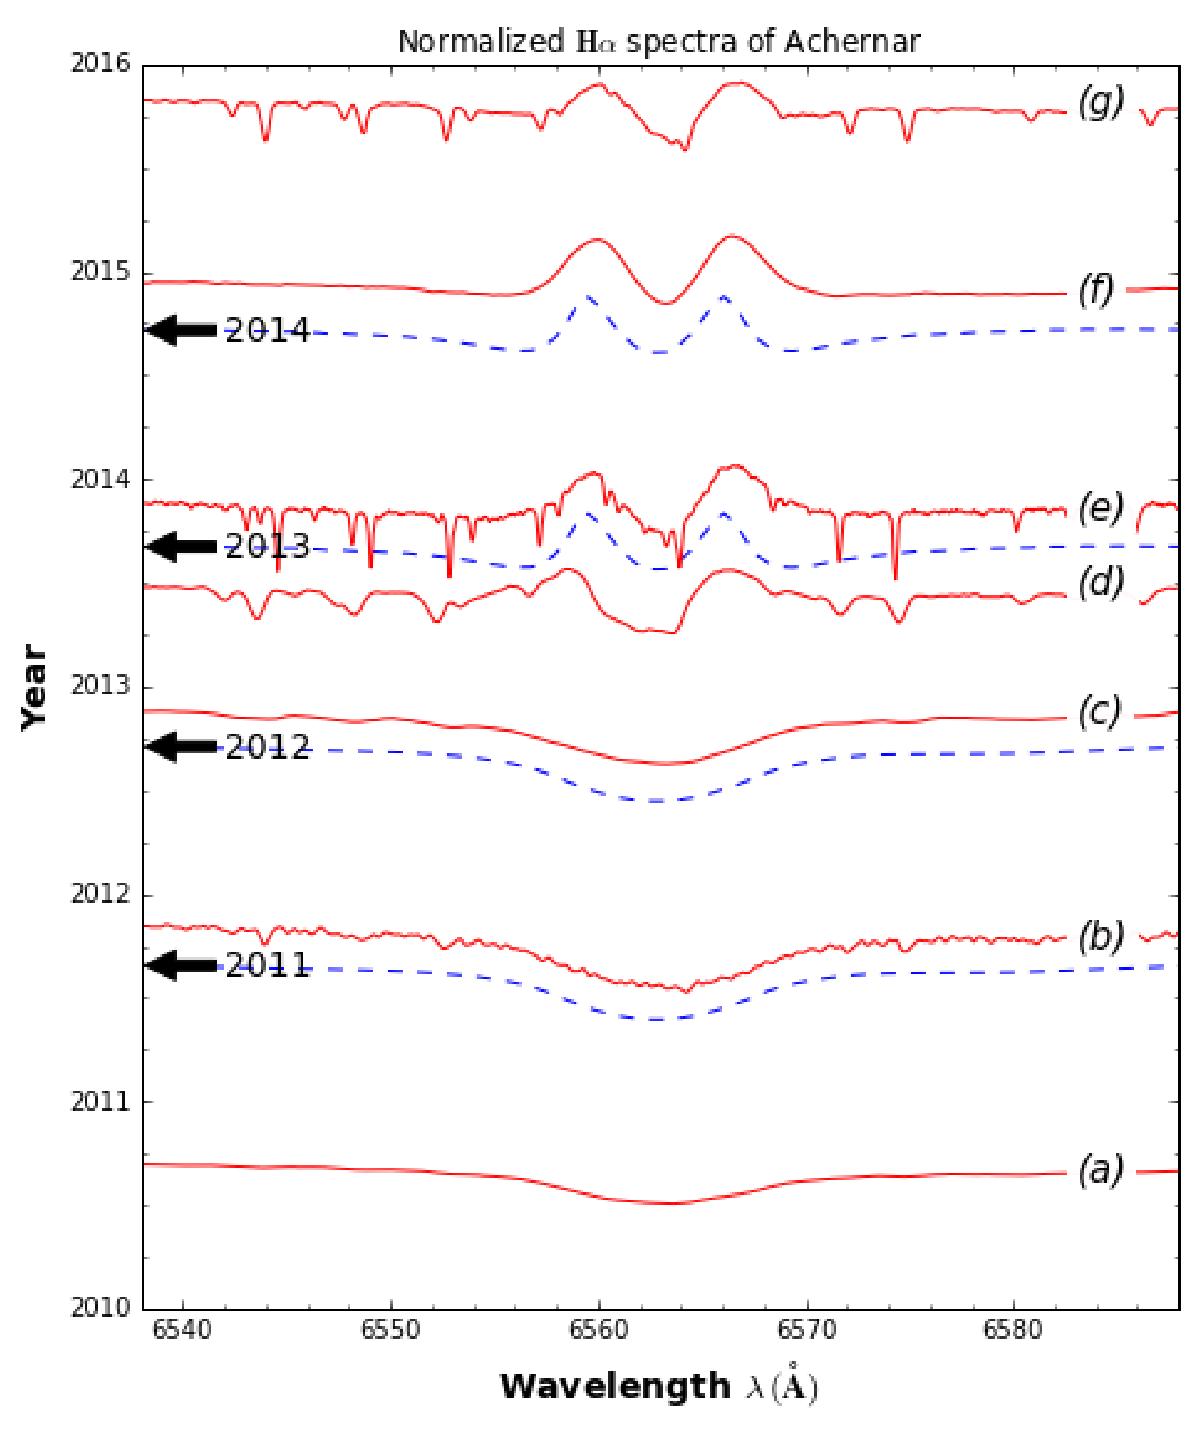
Normalized Hα line profiles of Achernar taken at different epochs between the end of 2011 and the end of 2015. The arrows indicate the PIONIER observations corresponding to Table 1. The dashed lines correspond to the model Hα line profile computed (1) with CHARRON (see Sect. 4.1) for the photospheric RvZ model (epochs 2011 and 2012) and (2) with HDUST (see Sect. 4.2) for the photosphere and disk model (epochs 2013 and 2014). Origin of the spectra and observers: (a) BESS 2010-09-03 (observer: Romeo), (b) BESS 2011-10-18 (observer: Heathcote), (c) OPD-ECASS-Brazil 2012-11-20 (observer: Moser Faes), (d) Brazil 2013-07-02 (observers: Marcon & Napoleão), (e) OPD-MUSICOS-Brazil 2013-11-13 (observer: Moser Faes), (f) BESS 2014-11-28 (observer: Powles), (g) BESS 2015-10-24 (observer: Luckas).
Current usage metrics show cumulative count of Article Views (full-text article views including HTML views, PDF and ePub downloads, according to the available data) and Abstracts Views on Vision4Press platform.
Data correspond to usage on the plateform after 2015. The current usage metrics is available 48-96 hours after online publication and is updated daily on week days.
Initial download of the metrics may take a while.