Fig. 7
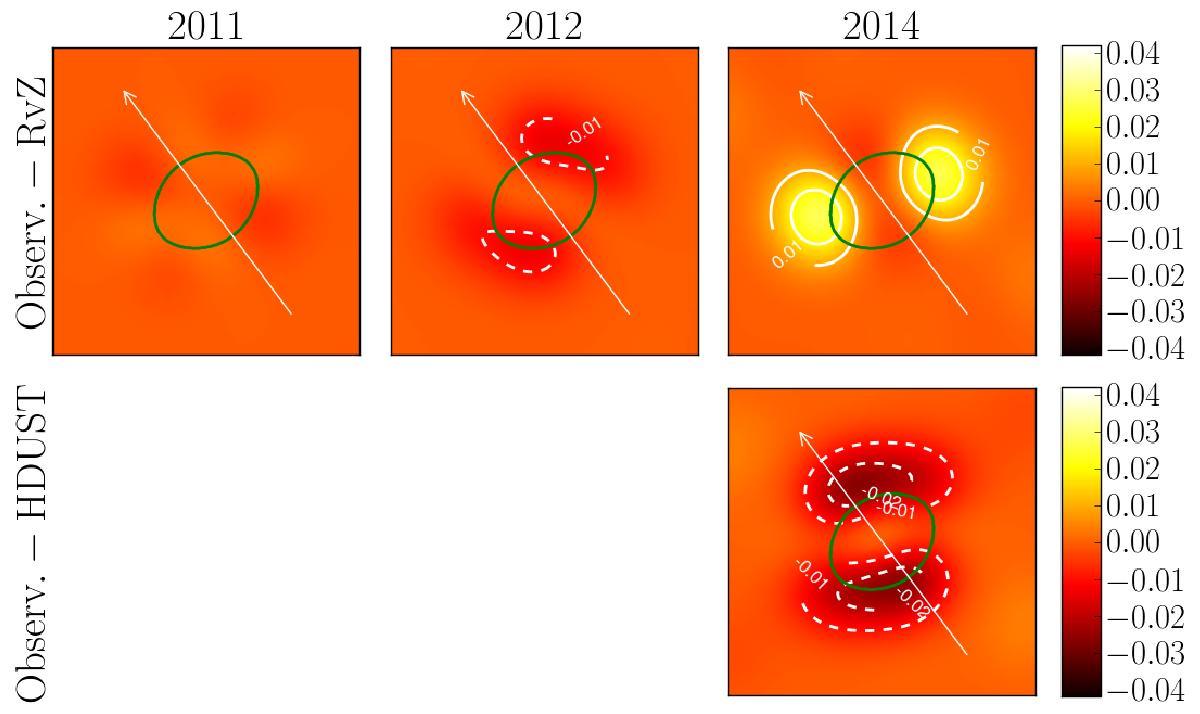
Subtraction between the reconstructed image of Achernar and both the RvZ and HDUST models. On the top row, subtraction between the images reconstructed from the observed data and artificial data calculated from the RvZ model of the photosphere of the star. On the bottom row, subtraction between the reconstructed image from the observed data and from the artificial data calculated form the HDUST model of the photosphere and circumstellar disk. The dynamic of the images is equal to 1. The green ellipse indicates the profile of the RvZ model of the photosphere model of Achernar. The subtraction images are highlighted with contours −0.02, −0.01, 0.01, 0.02. East is left and north is up. The long arrow shows the previously estimated position angle of the rotation axis of the star on the plane of sky. All datasets have been submitted to the same image reconstruction procedure.
Current usage metrics show cumulative count of Article Views (full-text article views including HTML views, PDF and ePub downloads, according to the available data) and Abstracts Views on Vision4Press platform.
Data correspond to usage on the plateform after 2015. The current usage metrics is available 48-96 hours after online publication and is updated daily on week days.
Initial download of the metrics may take a while.