Fig. 5
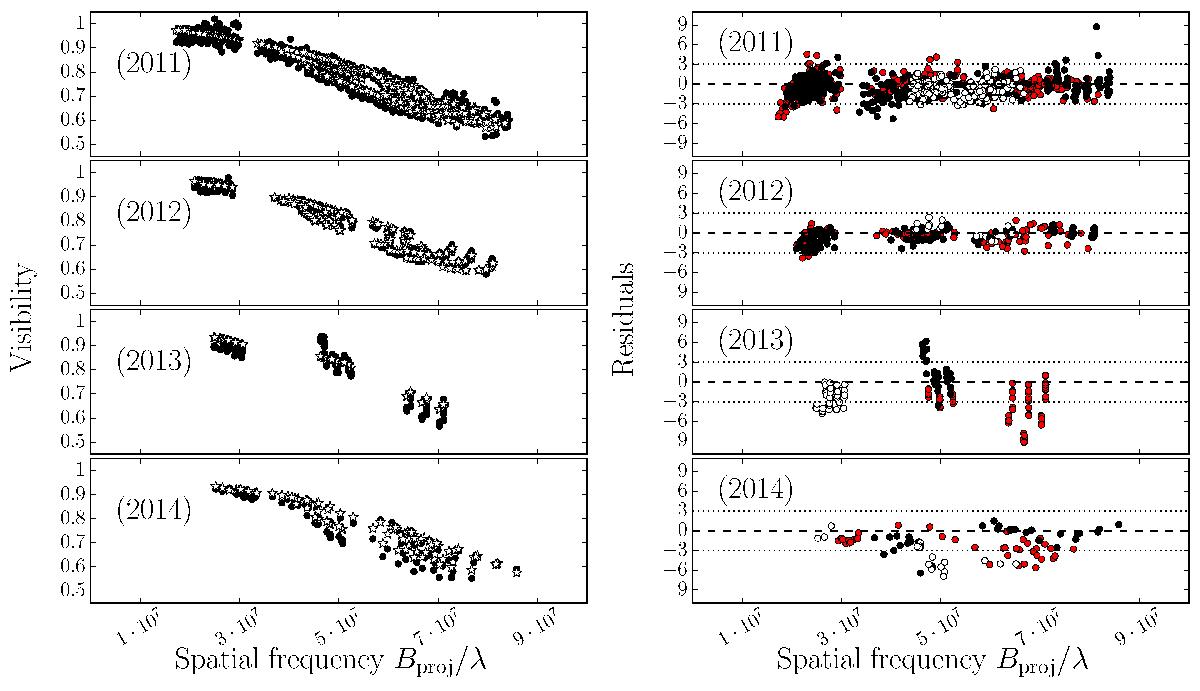
Roche-von Zeipel model compared to the Achernar data. Left: observed (black dots) and modeled (white stars) visibilities of Achernar. Right: residual of the visibility between the observations and the RvZ model as a function of the spatial frequency for each dataset. Colors indicate polar and equatorial axes, respectively, as in Fig. 1.
Current usage metrics show cumulative count of Article Views (full-text article views including HTML views, PDF and ePub downloads, according to the available data) and Abstracts Views on Vision4Press platform.
Data correspond to usage on the plateform after 2015. The current usage metrics is available 48-96 hours after online publication and is updated daily on week days.
Initial download of the metrics may take a while.