Fig. 1
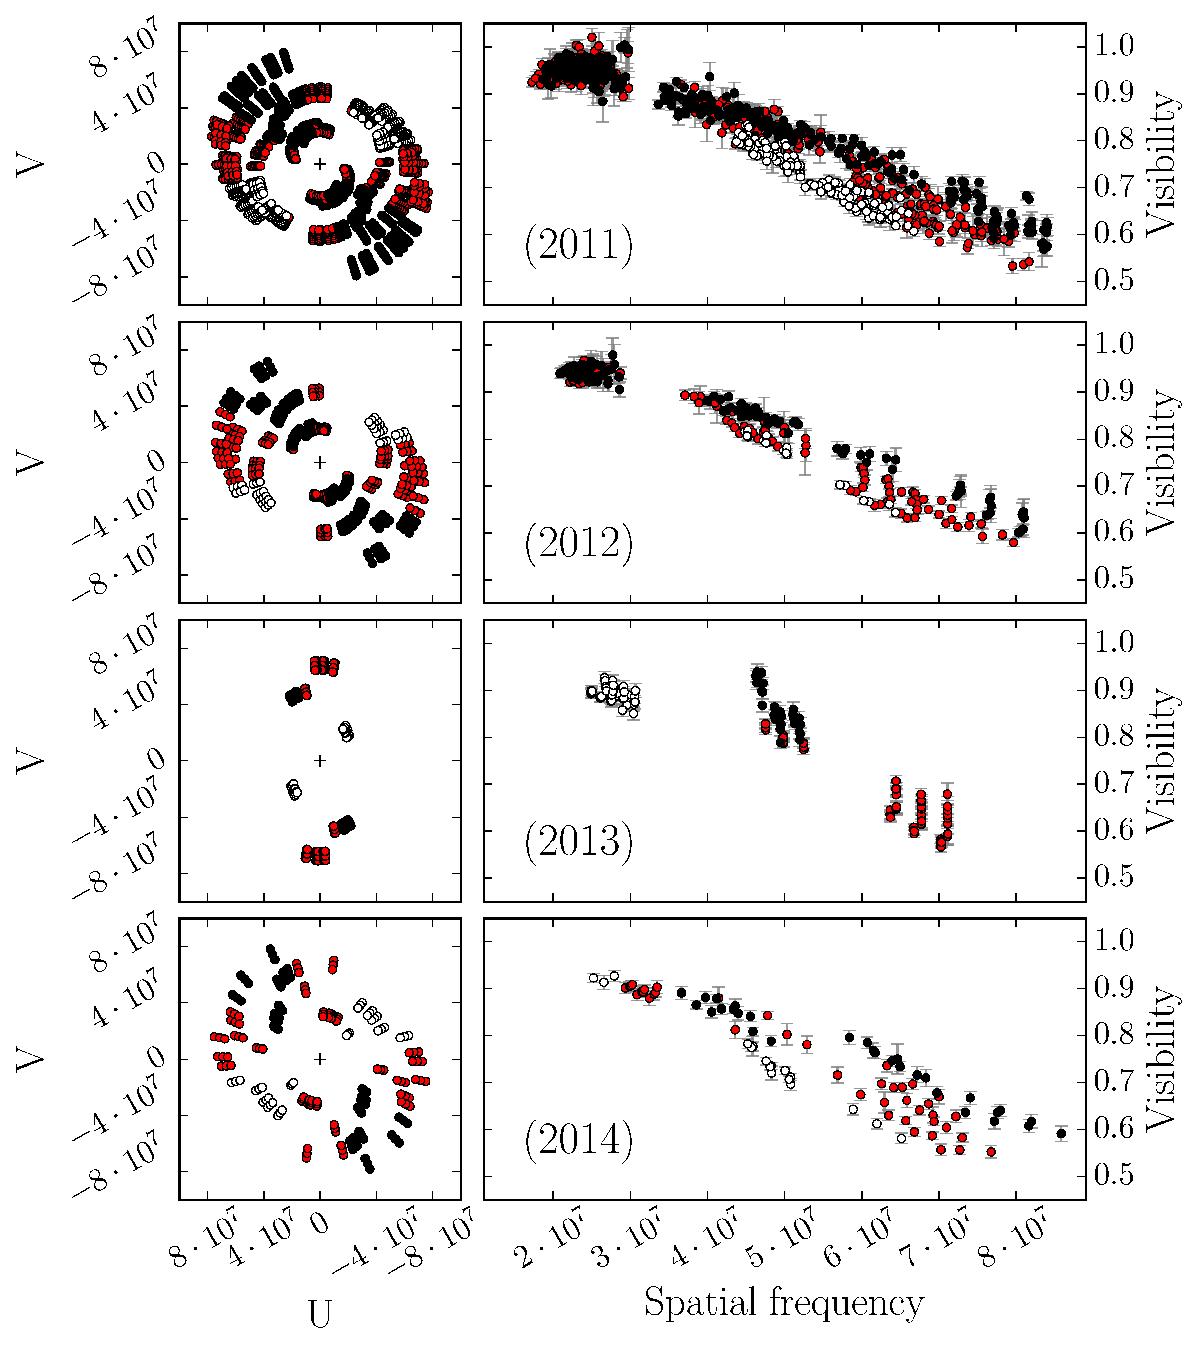
Left: spatial frequencies (u,v) coverage for each dataset. Right: visibility amplitudes (with their respective error bars) as a function of spatial frequency (B/λ in units of rad-1) for each dataset. Epochs 2011, 2012, 2013, and 2014 are represented from top to bottom. Colors indicate position angle (PA) ranges. Black circles correspond to regions around polar axis of the star PApol = 36.9° (14.4° ≤ PA ≤ 59.4°), hollow circles match the equatorial axis PAeq = 126.9° (104.4° ≤ PA ≤ 159.4°), and red circles correspond to the other directions.
Current usage metrics show cumulative count of Article Views (full-text article views including HTML views, PDF and ePub downloads, according to the available data) and Abstracts Views on Vision4Press platform.
Data correspond to usage on the plateform after 2015. The current usage metrics is available 48-96 hours after online publication and is updated daily on week days.
Initial download of the metrics may take a while.