Free Access
Fig. 9
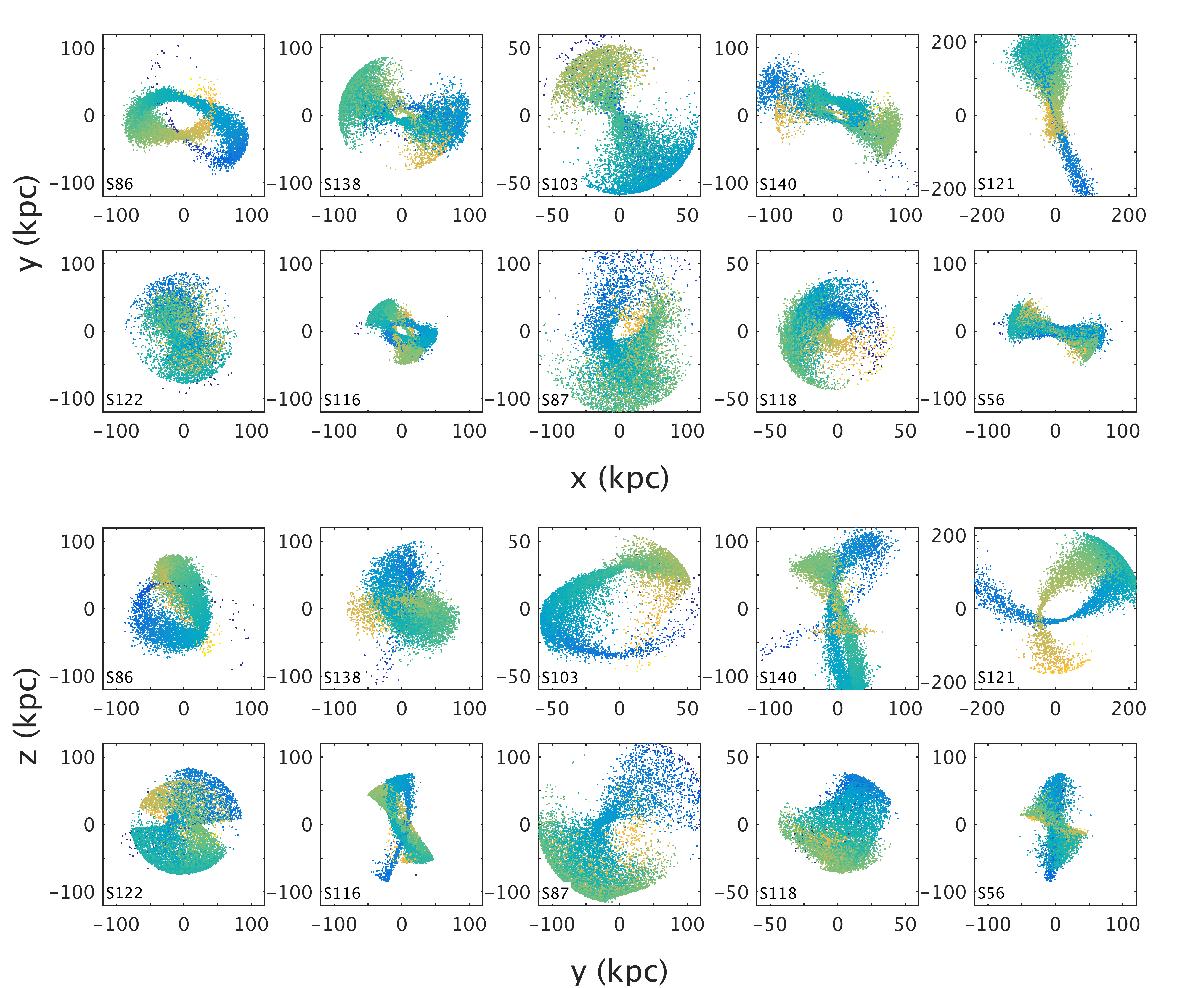
Spatial distribution of our selection of test-particle streams after 10 Gyr of evolution in the axisymmetric Kuzmin-Kutuzov potential. The colours represent the energy gradient, with the most bound particles in yellow and those least bound in blue. The z-axis is aligned with the major axis of the potential.
Current usage metrics show cumulative count of Article Views (full-text article views including HTML views, PDF and ePub downloads, according to the available data) and Abstracts Views on Vision4Press platform.
Data correspond to usage on the plateform after 2015. The current usage metrics is available 48-96 hours after online publication and is updated daily on week days.
Initial download of the metrics may take a while.