Fig. 3
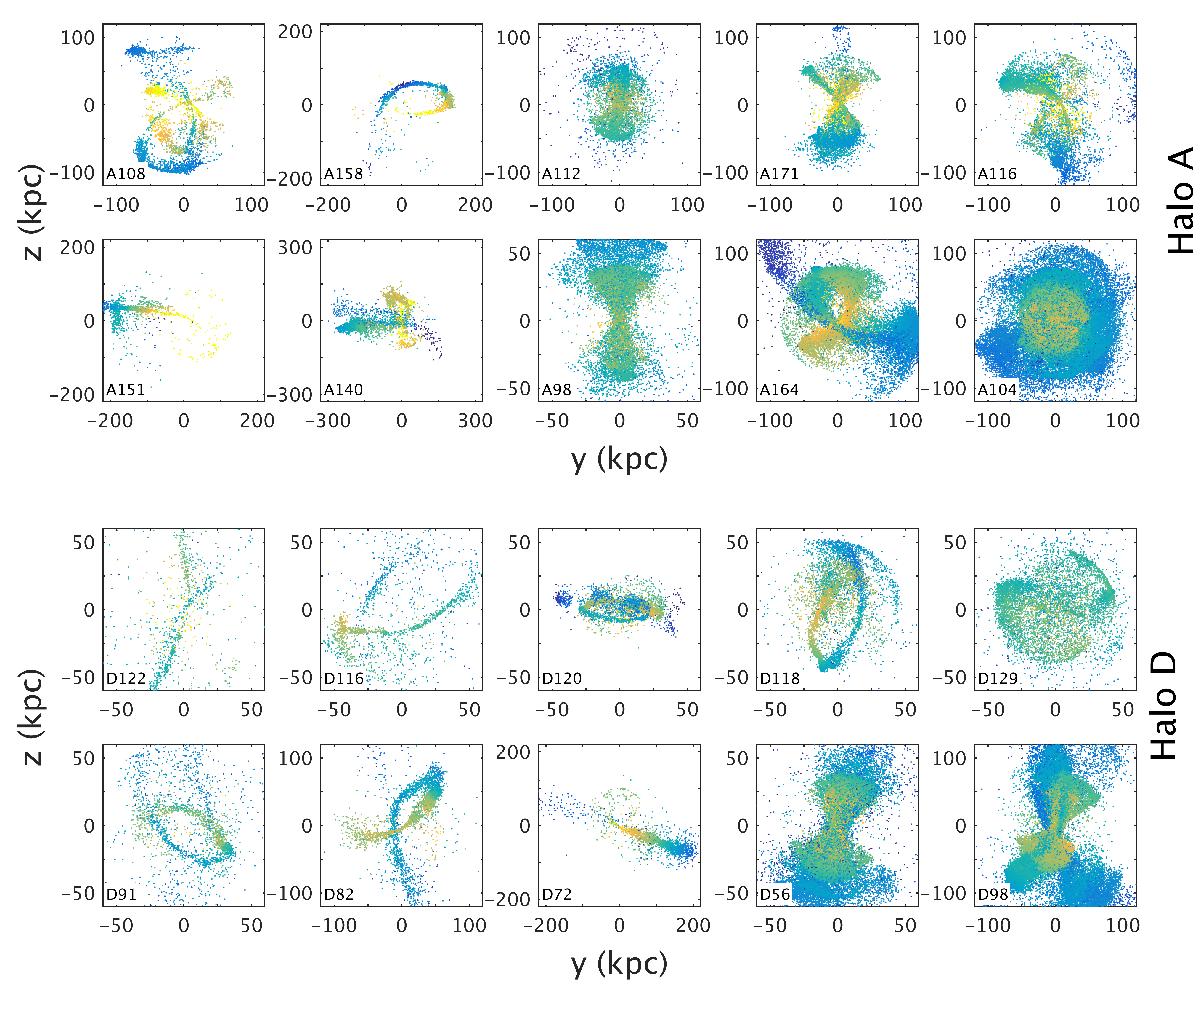
Stream-like objects in Aq-A (top) and Aq-D (bottom) in the same projection as in the top panel of Fig. 2. Shown here are the “tagged” dark matter particles while the labels indicate the object IDs used throughout this paper. The ranges are different in each panel to show the streams in maximum detail. The colours represent the energy gradient computed using the best-fitting spherical NFW potential, with yellow the most bound particles and blue those least bound. The streams have been sorted by dark matter mass, with the lightest stream on the top-left and the most massive on the bottom-right.
Current usage metrics show cumulative count of Article Views (full-text article views including HTML views, PDF and ePub downloads, according to the available data) and Abstracts Views on Vision4Press platform.
Data correspond to usage on the plateform after 2015. The current usage metrics is available 48-96 hours after online publication and is updated daily on week days.
Initial download of the metrics may take a while.