Fig. D.1
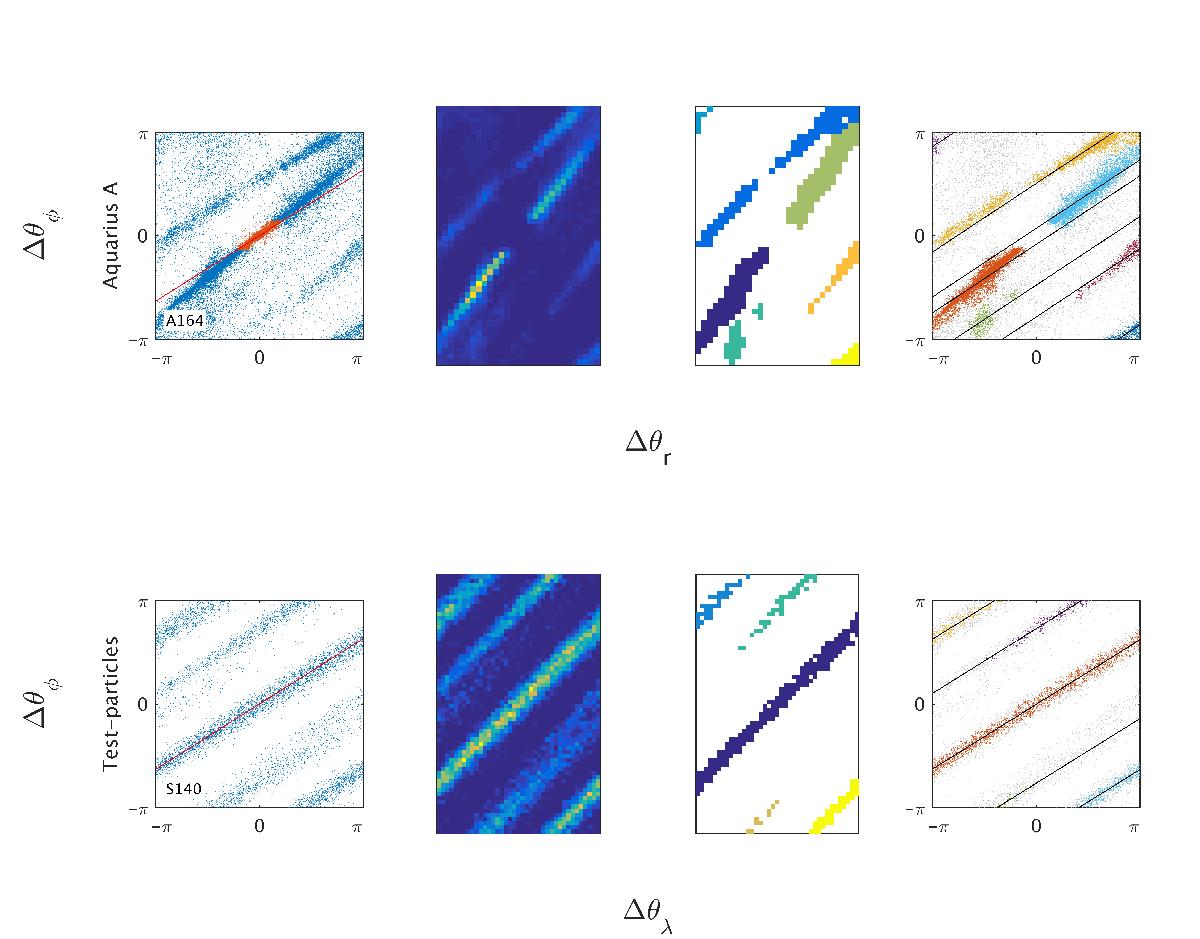
Examples of the straight lines fitting routine for stream A164 (top panels) and the test-particle simulations’ S140. In the left panel we show the stream in angle space with possible bound particles in red and the straight line obtained by fitting the frequency distribution. The second panel shows the streams in bins, where the axis have been scaled such that the streams are oriented at 45 deg. The third panel shows the groupings found by the pattern-filling algorithm. The last panel shows the resulting straight lines determined using parallel fitting.
Current usage metrics show cumulative count of Article Views (full-text article views including HTML views, PDF and ePub downloads, according to the available data) and Abstracts Views on Vision4Press platform.
Data correspond to usage on the plateform after 2015. The current usage metrics is available 48-96 hours after online publication and is updated daily on week days.
Initial download of the metrics may take a while.