Fig. 17
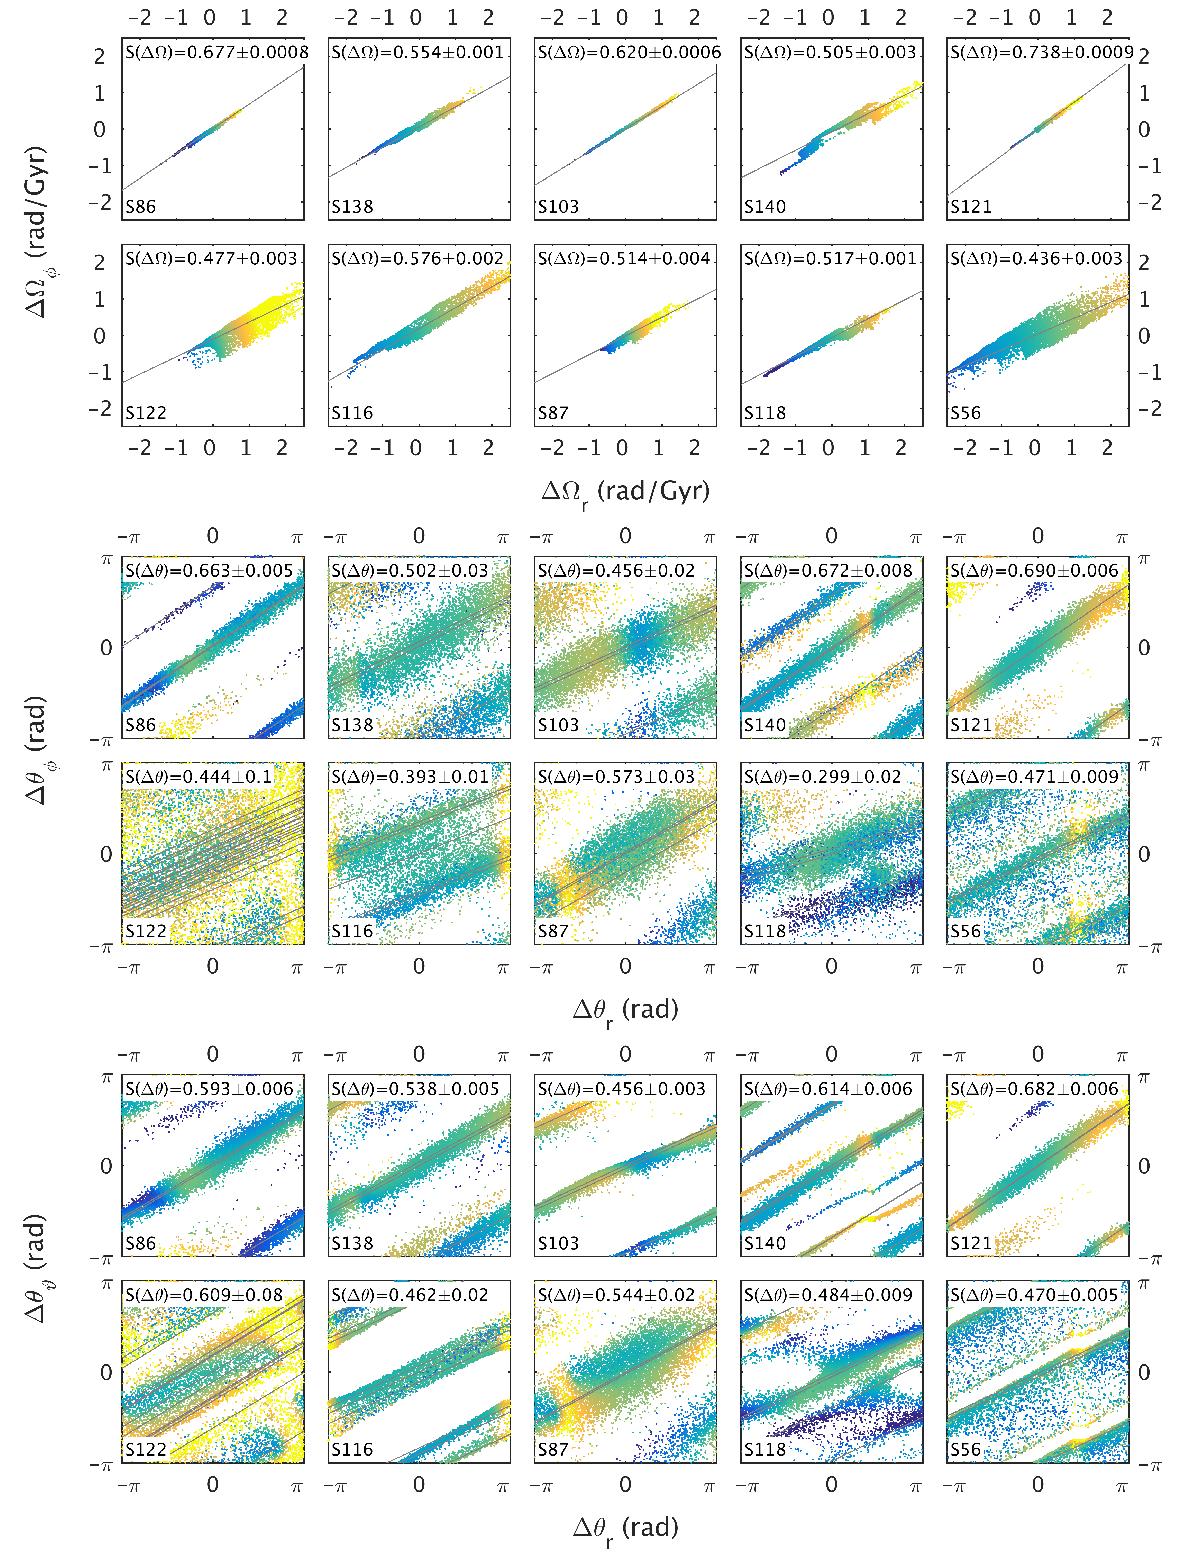
Test-particle streams from Fig. 9–11 with the frequencies ΔΩr−ΔΩφ (top panels) and angles Δθr−Δθφ (middle panels) and Δθr−Δθϑ (bottom panels), computed using an NFW potential that has the same slope at a fixed radius as the limiting spherical isochrone potential (see Fig. C.1). The colours represent the energy gradient in the NFW potential. The panels have been centred on the progenitor position. The insets indicate the fitted slopes for the approximate potential. The errors were found by bootstrapping the fit 200 times.
Current usage metrics show cumulative count of Article Views (full-text article views including HTML views, PDF and ePub downloads, according to the available data) and Abstracts Views on Vision4Press platform.
Data correspond to usage on the plateform after 2015. The current usage metrics is available 48-96 hours after online publication and is updated daily on week days.
Initial download of the metrics may take a while.