Fig. 17
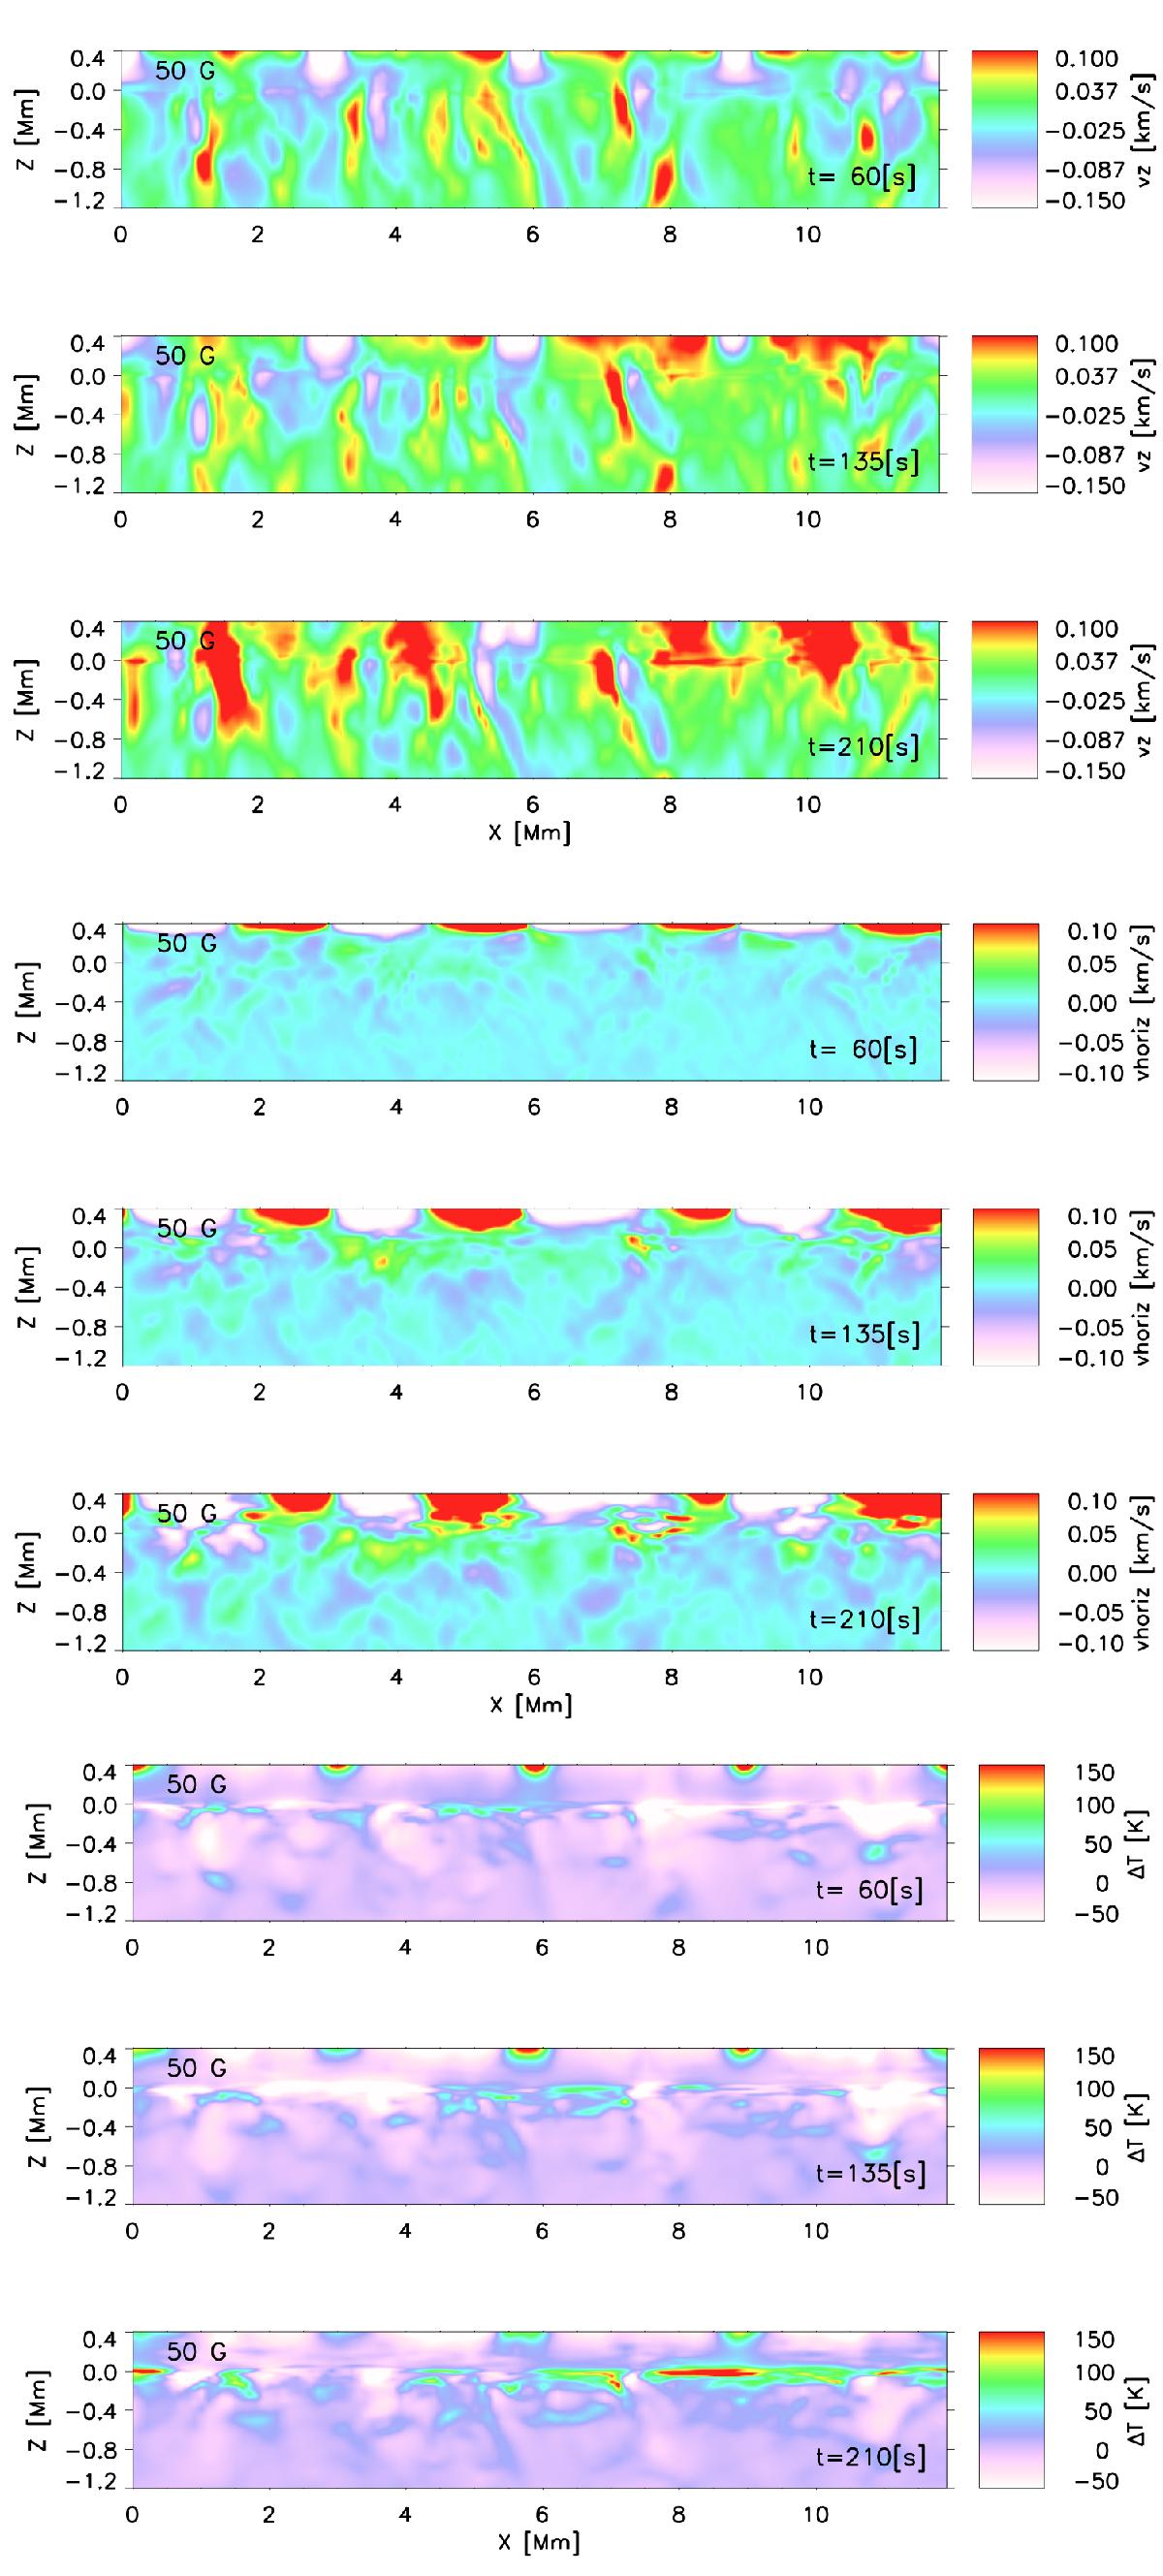
Difference between the simulation run with alternating magnetic polarity stripes and the unipolar magnetic field simulation for an initial field strength of 50 G. Top, middle, bottom plot in each panel correspond to t = 60 s, 135 s and t = 210 s respectively. Top panel: vertical velocity difference in km s-1, middle panel: horizontal velocity difference in km s-1, bottom panel: temperature difference.
Current usage metrics show cumulative count of Article Views (full-text article views including HTML views, PDF and ePub downloads, according to the available data) and Abstracts Views on Vision4Press platform.
Data correspond to usage on the plateform after 2015. The current usage metrics is available 48-96 hours after online publication and is updated daily on week days.
Initial download of the metrics may take a while.