Fig. A.1
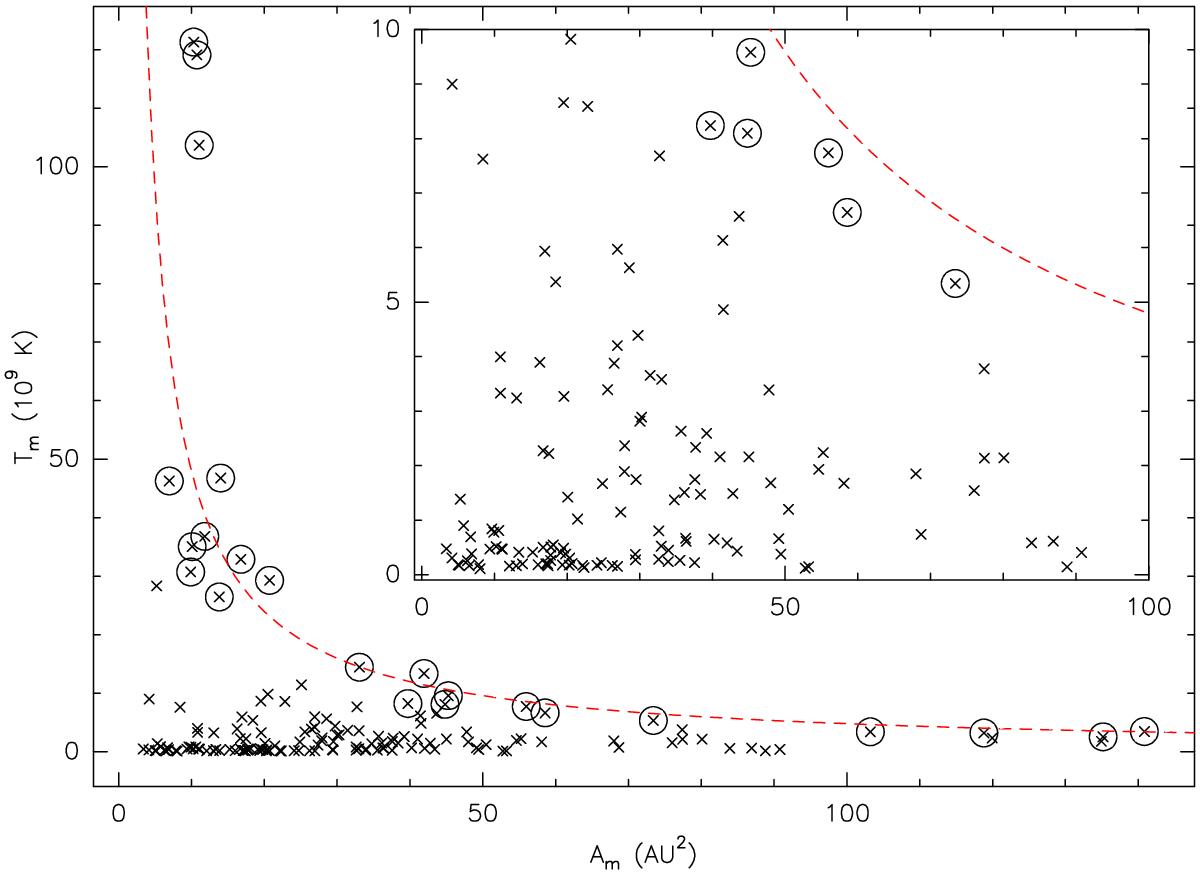
Brightness temperature of the spots (in units of 109 K) vs. the deconvolved sky-projected spot area (in AU2). The spot area is defined as Am = (π/ 4) ab, a and b being the deconvolved FWHM along the major and minor axes, respectively. Circles with crosses indicate the spots with TmAm ≥ 300 × 109 K AU2. The red dashed line gives the best hyperbolic fit to these points, Tm ∝ 1/Am. The inset shows an enlargement of the region with Tm ≤ 1010 K.
Current usage metrics show cumulative count of Article Views (full-text article views including HTML views, PDF and ePub downloads, according to the available data) and Abstracts Views on Vision4Press platform.
Data correspond to usage on the plateform after 2015. The current usage metrics is available 48-96 hours after online publication and is updated daily on week days.
Initial download of the metrics may take a while.