Fig. 3
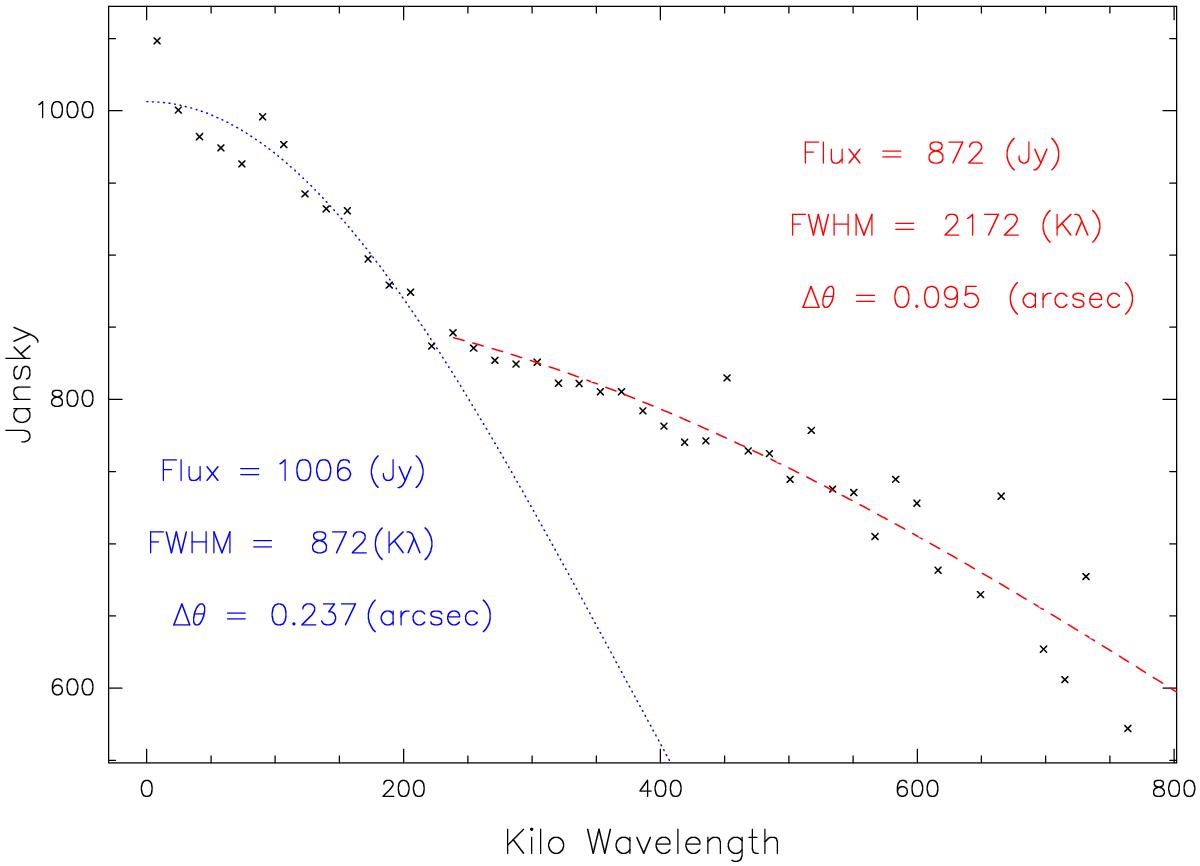
Visibility amplitude vs. JVLA baseline length for the brightest maser channel (at VLSR = 6.43 km s-1). The blue dotted and red dashed lines show the Gaussian fits to the amplitude profile using only data with baseline lengths lower and higher than 235 Kλ, respectively, which is the maximum baseline sampled with the B-Array. The amplitude and FWHM size of the fitted Gaussians are reported with consistent colors.
Current usage metrics show cumulative count of Article Views (full-text article views including HTML views, PDF and ePub downloads, according to the available data) and Abstracts Views on Vision4Press platform.
Data correspond to usage on the plateform after 2015. The current usage metrics is available 48-96 hours after online publication and is updated daily on week days.
Initial download of the metrics may take a while.