Fig. 2
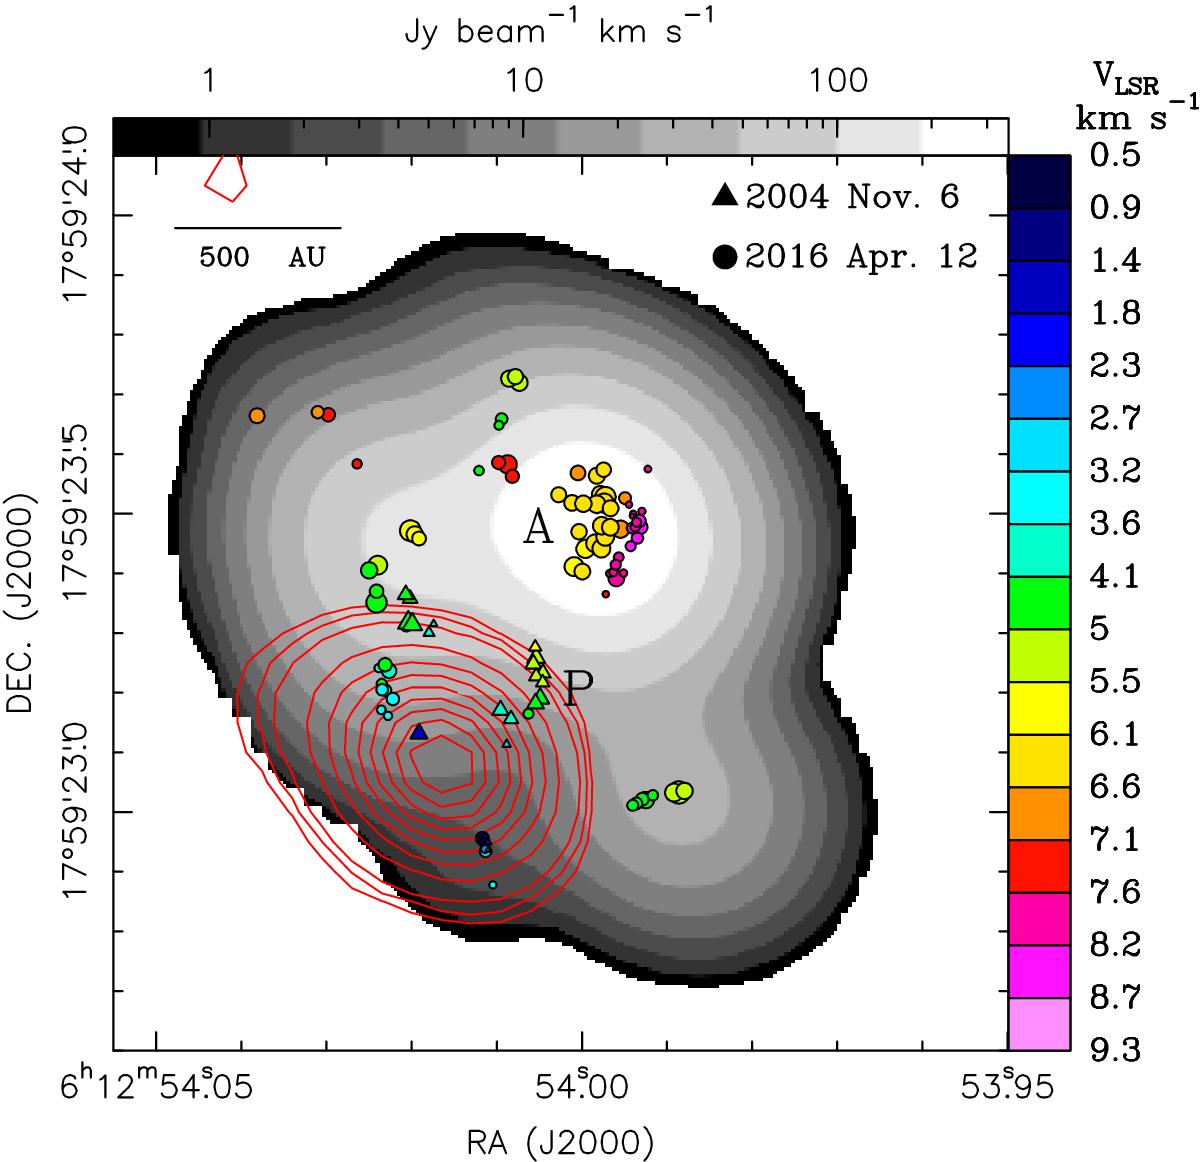
Distribution of the 6.7 GHz CH3OH masers toward NIRS 3. Circles and triangles represent maser spots before and after the outburst, respectively. Relative maser positions between the two epochs are accurate within a few mas. Note that the apparent motion of the 6.7 GHz CH3OH masers in NIRS 3 between the two EVN epochs is negligible (Rygl et al. 2010). The symbol size varies logarithmically with the maser brightness, and colors indicate the maser VLSR according to the right-hand scale. Letters “A” and “P” are used to label prominent maser clusters. The gray-scale image shows the velocity-integrated emission of the 6.7 GHz masers observed with the JVLA A-Array on 2016 October 15. The corresponding intensity scale is given at the top. The JVLA 5 GHz continuum emission is drawn with red contours. The rms noise of the image is 12 μJy beam-1. Contour levels are 0.11, 0.15, and from 0.22 to 2 mJy beam-1 in steps of 0.22 mJy beam-1. The synthesized beam of the continuum map is 0.′′25 × 0.′′24 at PA = 51°.
Current usage metrics show cumulative count of Article Views (full-text article views including HTML views, PDF and ePub downloads, according to the available data) and Abstracts Views on Vision4Press platform.
Data correspond to usage on the plateform after 2015. The current usage metrics is available 48-96 hours after online publication and is updated daily on week days.
Initial download of the metrics may take a while.