Fig. 1
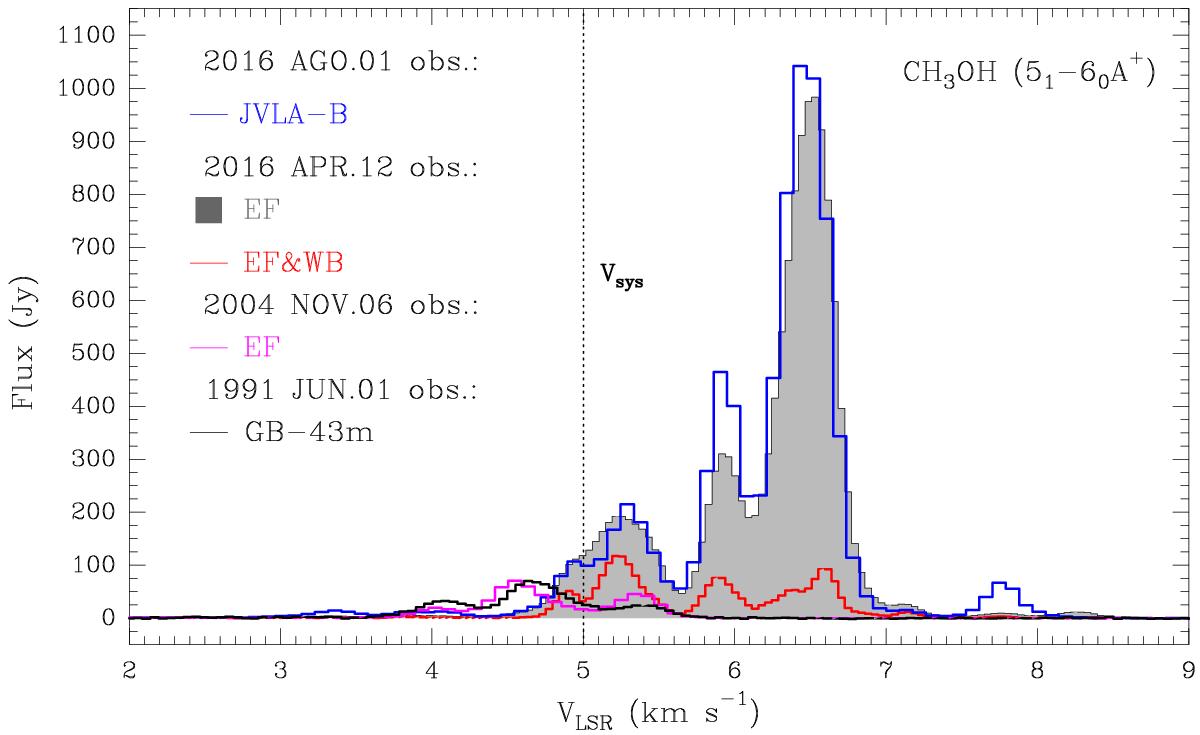
Comparison of 6.7 GHz CH3OH maser spectra obtained toward NIRS 3. Two single-dish pre-burst spectra obtained with the Green Bank (GB–43 m, black) and Effelsberg (EF, magenta) antennas are compared with the emission detected during the outburst phase at three different baselines: an EF total-power (filled histogram), a cross-power (red) of the EF and Westerbork (WB) baseline (~250 km), and a synthesized VLA spectrum (blue) obtained in the B configuration (maximum baseline of 11 km). The legend on the left side reports the observing dates. The dotted vertical line indicates the systemic velocity (Vsys) of the source S255-SMA1 from Zinchenko et al. (2015).
Current usage metrics show cumulative count of Article Views (full-text article views including HTML views, PDF and ePub downloads, according to the available data) and Abstracts Views on Vision4Press platform.
Data correspond to usage on the plateform after 2015. The current usage metrics is available 48-96 hours after online publication and is updated daily on week days.
Initial download of the metrics may take a while.