Fig. 3
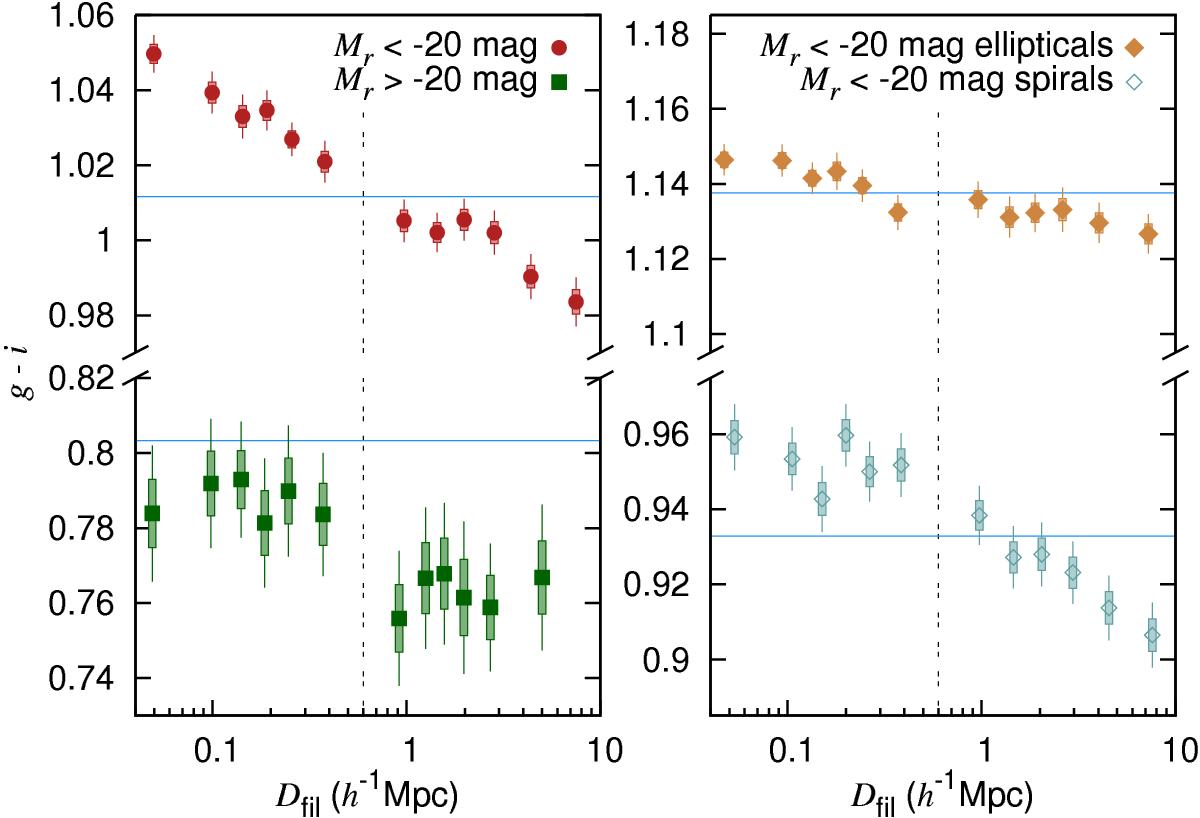
Average g−i values as a function of the distance Dfil. In the left panel red circles are for the brighter sample and green squares for the fainter sample. In the right panel there are separate distributions for the brighter sample spiral and elliptical galaxies according to the HC11 classification. Yellow diamonds indicate ellipticals and blue diamonds indicate spirals. The horizontal blue lines represent the average g−i values for the corresponding volume-limited samples.
Current usage metrics show cumulative count of Article Views (full-text article views including HTML views, PDF and ePub downloads, according to the available data) and Abstracts Views on Vision4Press platform.
Data correspond to usage on the plateform after 2015. The current usage metrics is available 48-96 hours after online publication and is updated daily on week days.
Initial download of the metrics may take a while.