Fig. 2
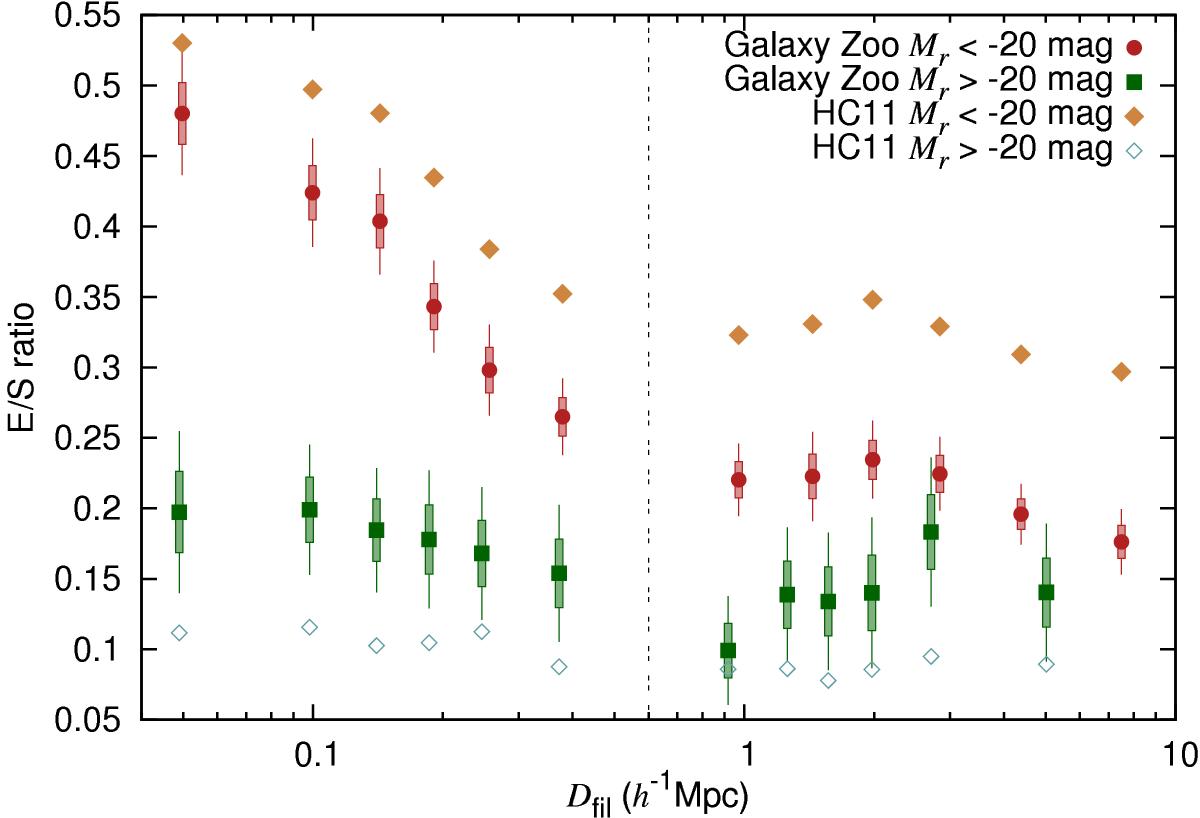
Average E/S ratios as a function of the distance Dfil. Galaxy Zoo morphologies are represented by red circles for the brighter sample and by green squares for the fainter sample. Classifications from HC11 are shown by filled yellow diamonds for the brighter sample and by empty blue diamonds for the fainter sample. The bootstrap uncertainties for the HC11 dataset are smaller than the points on the graph.
Current usage metrics show cumulative count of Article Views (full-text article views including HTML views, PDF and ePub downloads, according to the available data) and Abstracts Views on Vision4Press platform.
Data correspond to usage on the plateform after 2015. The current usage metrics is available 48-96 hours after online publication and is updated daily on week days.
Initial download of the metrics may take a while.