Fig. 4
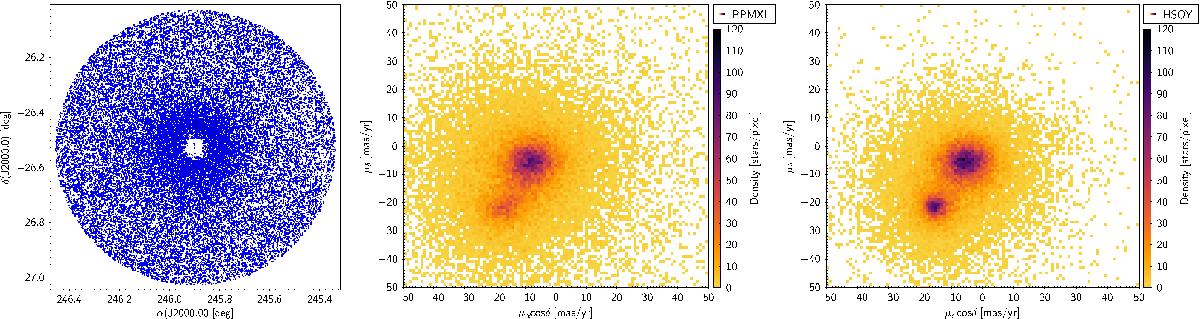
Left panel: plot of the field with a radius of 30′ taken from the HSOY catalogue centred around M 4 . Centre and right panels: vector point diagrams of the M 4 region with proper motions taken from the PPMXL (centre) and HSOY (right). The hole in the middle of the plot is caused by the strong crowding in the central part of M 4; the few points inside this hole can be considered as spurious, which means they have to be suppressed in any kind of analysis.
Current usage metrics show cumulative count of Article Views (full-text article views including HTML views, PDF and ePub downloads, according to the available data) and Abstracts Views on Vision4Press platform.
Data correspond to usage on the plateform after 2015. The current usage metrics is available 48-96 hours after online publication and is updated daily on week days.
Initial download of the metrics may take a while.