Free Access
Fig. 2
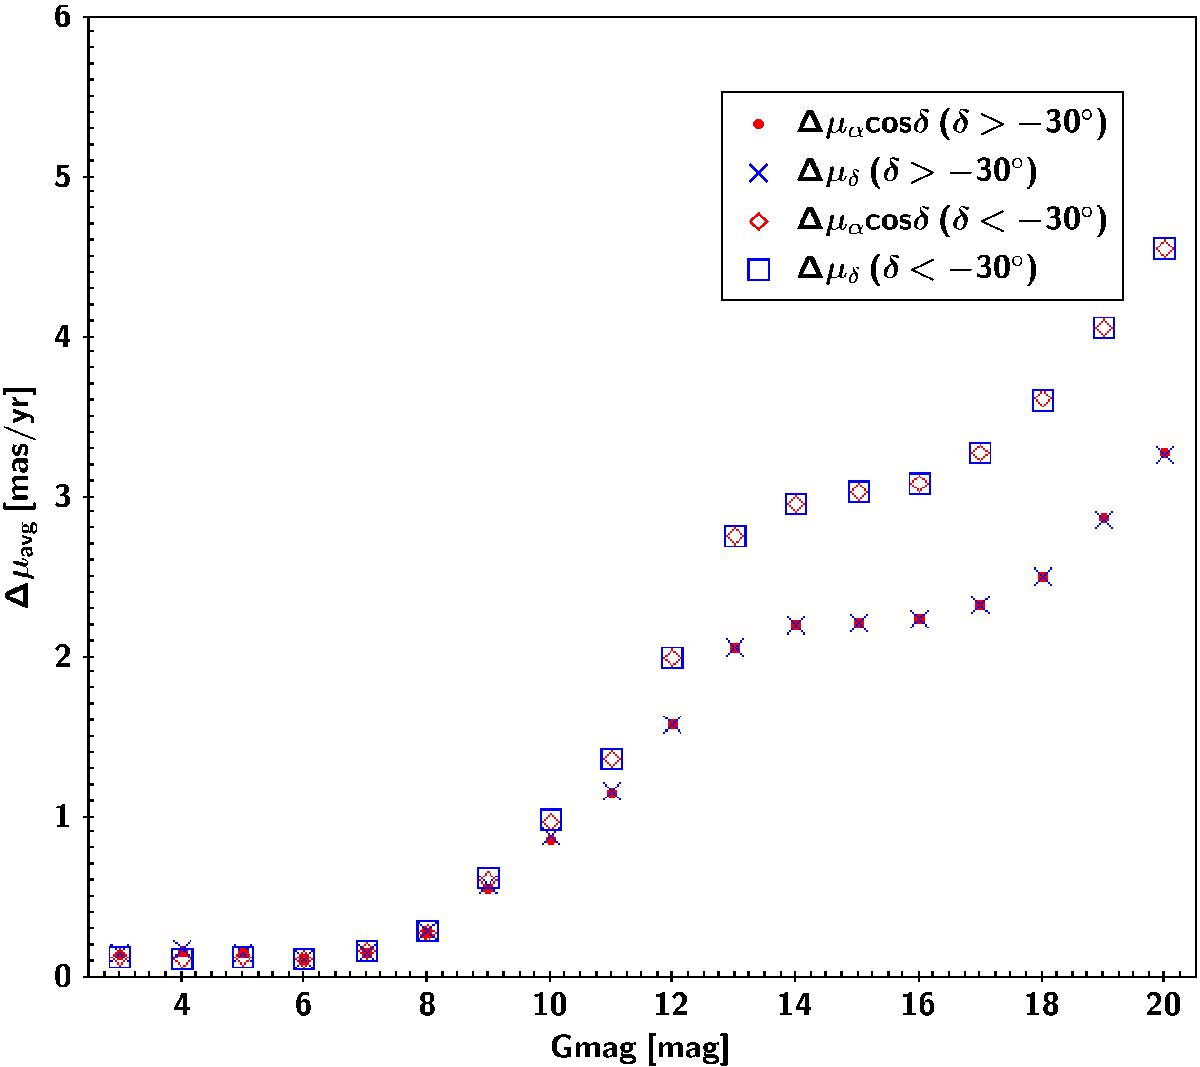
Mean standard errors in proper motions of the HSOY catalogue north and south of δ = −30°. The errors are given in bins of one magnitude centred on full Gaia G magnitudes. The symbols are defined in the legend box within the plot.
Current usage metrics show cumulative count of Article Views (full-text article views including HTML views, PDF and ePub downloads, according to the available data) and Abstracts Views on Vision4Press platform.
Data correspond to usage on the plateform after 2015. The current usage metrics is available 48-96 hours after online publication and is updated daily on week days.
Initial download of the metrics may take a while.