Fig. 9
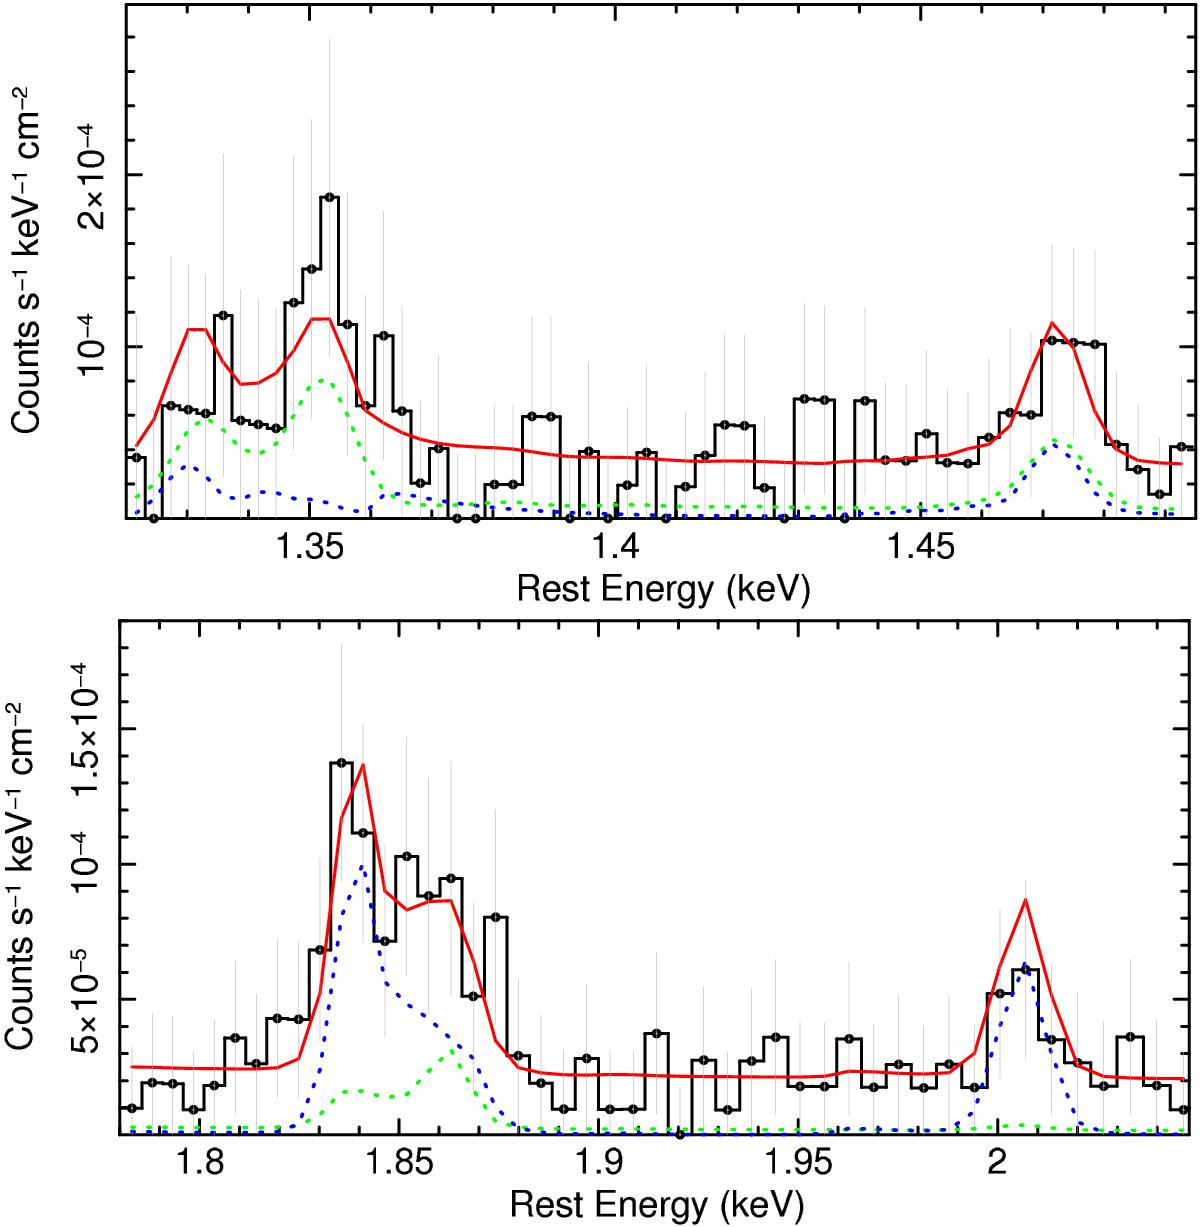
Zoom into the MEG spectrum (at HWHM resolution) at the energy of the Mg xi and Si xiii triplets. The emission component is modeled with a thermal emission model (green dotted line) and a photoionized emitter, which is modeled with an xstar grid (blue dotted line). The upper panel shows the Mg xi region, where the mekal component can reproduce the profile with a weak contribution from the xstar emission component. The lower panel shows that the Si xiii triplet as well as the Si xiv Lyα are mainly accounted for by the photoionized emiter component (blue dotted line), while the thermal emission component accounts for the residual emission at the energy of the resonance emission line of the Si xiii triplet. In both panels the red line shows the best-fit model where the emission line component is accounted for by a collisional gas (mekal) and photoionzed emitter (xstar; see Sect. 4.1.2).
Current usage metrics show cumulative count of Article Views (full-text article views including HTML views, PDF and ePub downloads, according to the available data) and Abstracts Views on Vision4Press platform.
Data correspond to usage on the plateform after 2015. The current usage metrics is available 48-96 hours after online publication and is updated daily on week days.
Initial download of the metrics may take a while.