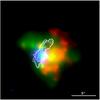
Fig. 7
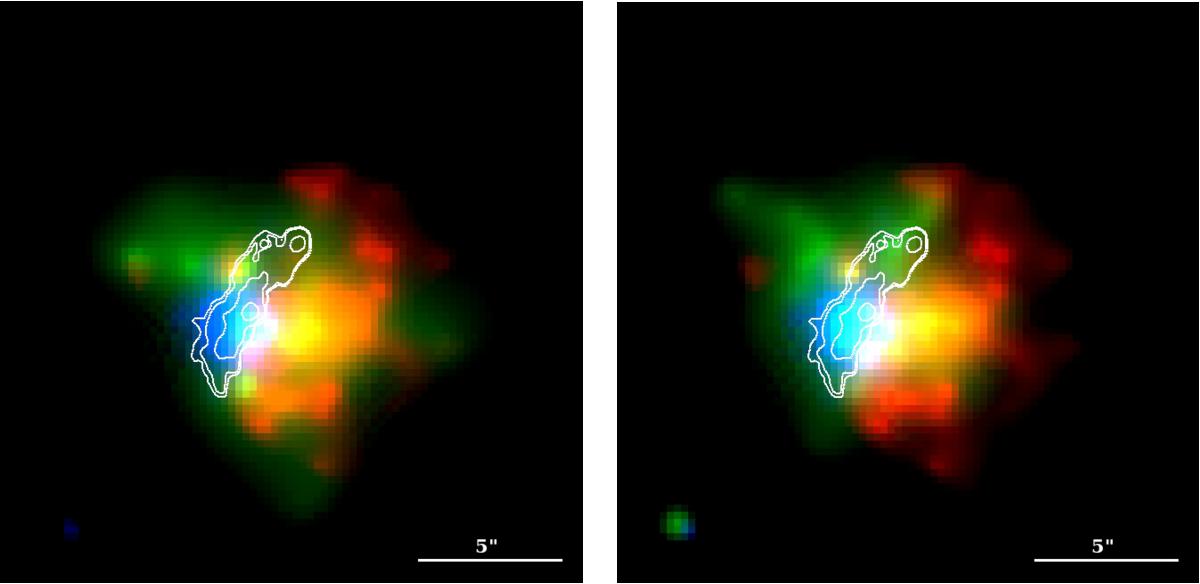
False color images of the central region (20″ × 20″) of NGC 7582. Left panel: the red represents the Ne band, green is for the Mg, and blue represents the harder emission (6–7 keV). In both of the panels the white contours show the location of the dust lane as derived from the HST images. The spatial scale is reported at the bottom (note that the Chandra PSF HEW is 0.5″). The Fe K band emission is less extended and close to a point-like appearance, while both the Mg and Ne emission are clearly extended. We note that the Mg diffuse emission is more on the east side of the hard nucleus with respect to the Ne, which, although more extended, is mainly distributed on the west side. This is due to the effect of obscuration by the dust lane present in NGC 7582, which affects the lower energy band more strongly. Right panel: the red and blue are again the Ne and Fe bands, while the green is for the Si band. The narrower source size in the Si band with respect to the Ne and Mg emission is apparent as well as the residual excess with respect to the Fe emission.
Current usage metrics show cumulative count of Article Views (full-text article views including HTML views, PDF and ePub downloads, according to the available data) and Abstracts Views on Vision4Press platform.
Data correspond to usage on the plateform after 2015. The current usage metrics is available 48-96 hours after online publication and is updated daily on week days.
Initial download of the metrics may take a while.