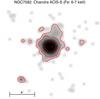
Fig. 6
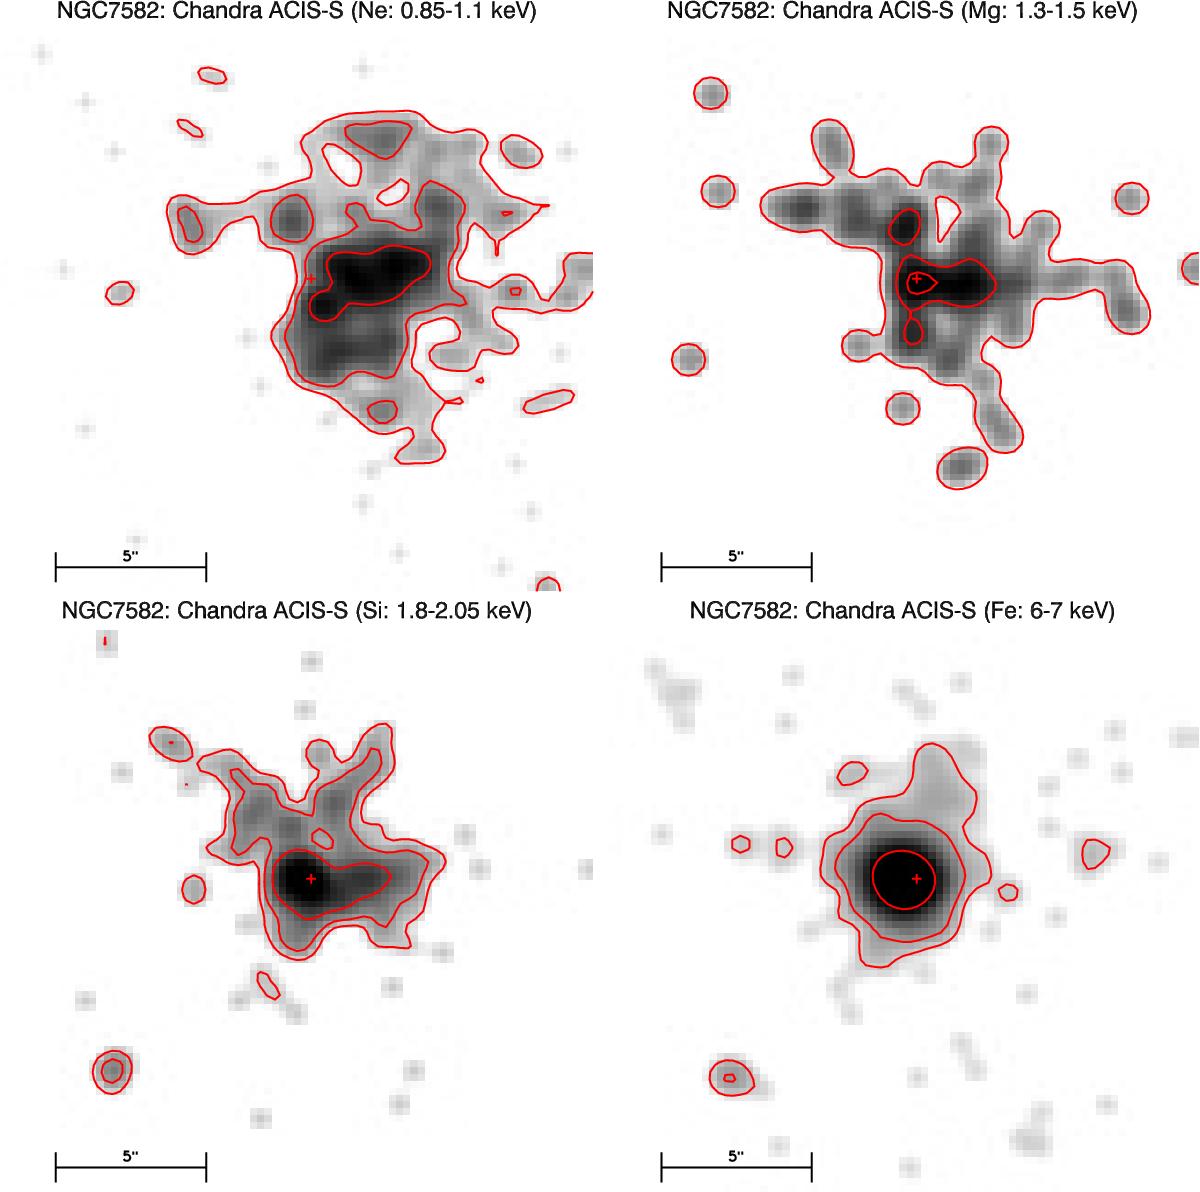
ACIS-S zeroth order images of NGC 7582 mapping, from top to bottom, the Ne ix-x (upper left panel), the Mg xi-xii (upper right panel), the Si xiii-xiv (lower left panel), and the Fe Kα (lower right panel) energy ranges. In all the images the red crosses indicate the coordinates of the nucleus (from NED) and the spatial scale is reported at the bottom (note that for NGC 7582 1″ corresponds to 109 pc). The emission appears to be spatially extended in almost all the energy ranges with a different morphology depending on the energy. The emission is progressively less extended with increasing energy and at the Fe Kα emission line it is almost consistent with a point-like source, albeit with a weak elongation in the north direction. The Chandra PSF HEW is 0.5″.
Current usage metrics show cumulative count of Article Views (full-text article views including HTML views, PDF and ePub downloads, according to the available data) and Abstracts Views on Vision4Press platform.
Data correspond to usage on the plateform after 2015. The current usage metrics is available 48-96 hours after online publication and is updated daily on week days.
Initial download of the metrics may take a while.