Fig. 3
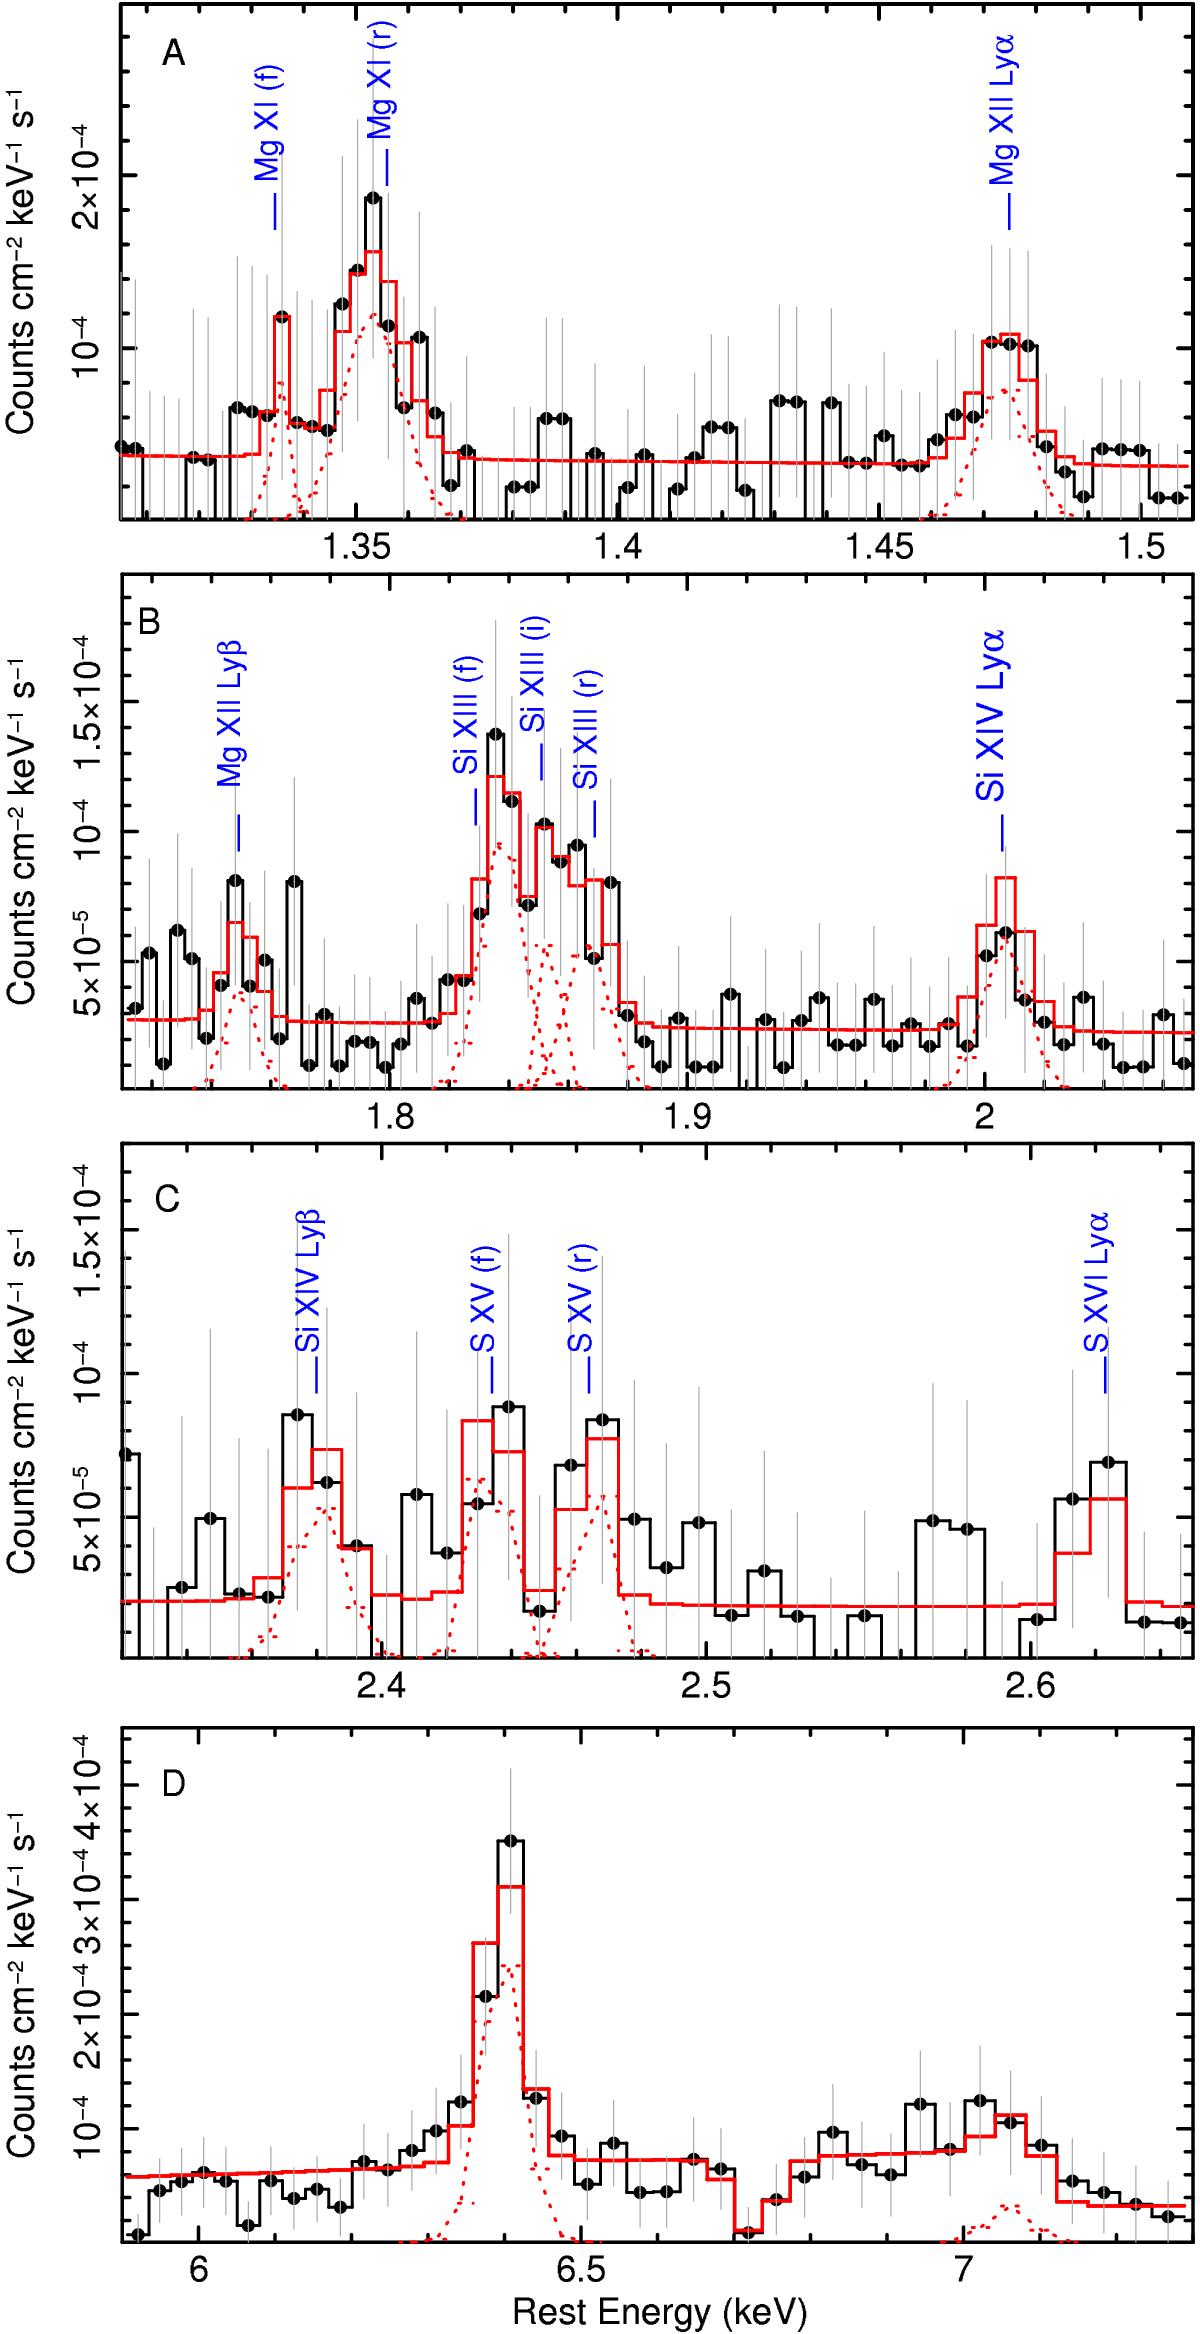
Zoom into the MEG (panels A, B, and C) and HEG spectra (panel D) showing the strongest emission line features. The spectra are binned at the FWHM resolution for both the MEG and HEG. The main Gaussian emission lines are labeled and shown with a red dashed line. Panel A) shows the Mg xi and Mg xii Lyα region. In panel B) we show a zoom into the region of the Mg xii Lyβ, Si xiii triplet, and Si xiv Lyα, while panel C) shows the S xv and S xvi range. In panel D) we show the Fe Kα region. Beside the Fe Kα line at ~ 6.4 keV, a possible weak absorption feature is present at ~ 6.7 keV.
Current usage metrics show cumulative count of Article Views (full-text article views including HTML views, PDF and ePub downloads, according to the available data) and Abstracts Views on Vision4Press platform.
Data correspond to usage on the plateform after 2015. The current usage metrics is available 48-96 hours after online publication and is updated daily on week days.
Initial download of the metrics may take a while.