Fig. 2
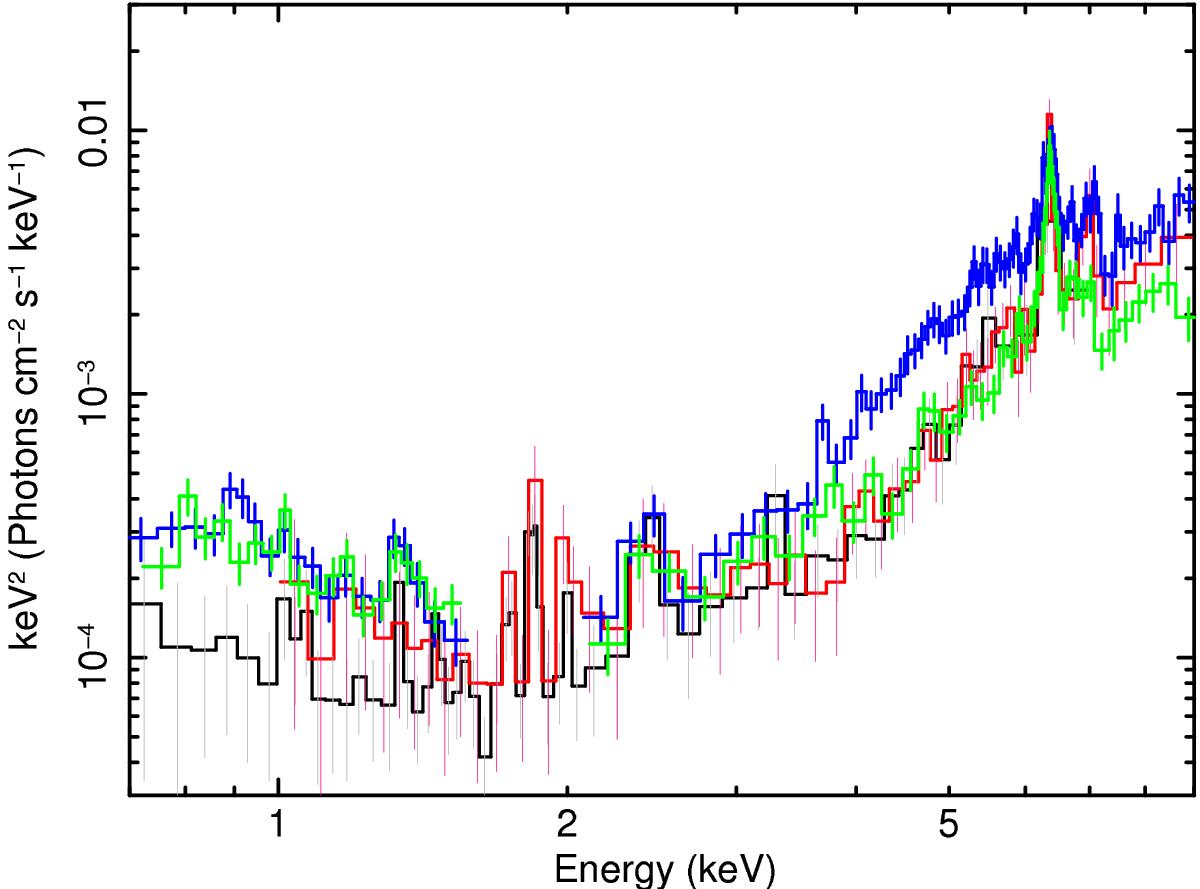
Comparison between the Chandra (HEG and MEG; red and black data points, respectively) and two of the Suzaku observations, which caught this AGN in the two different states representative of the Compton thin (NH ~ 4 × 1023 cm-2; blue data points) and thick (NH ~ 1.2 × 1024 cm-2; green data points) states. Above 2 keV the Chandra spectra are similar in observed flux and spectral shape to the typical Compton thick state observed by Suzaku. In the soft X-ray band the lower flux is due to the smaller extraction region of the Chandra grating data. The spectra are unfolded against a power law with Γ = 2 and rebinned for plotting purposes.
Current usage metrics show cumulative count of Article Views (full-text article views including HTML views, PDF and ePub downloads, according to the available data) and Abstracts Views on Vision4Press platform.
Data correspond to usage on the plateform after 2015. The current usage metrics is available 48-96 hours after online publication and is updated daily on week days.
Initial download of the metrics may take a while.