Fig. 1
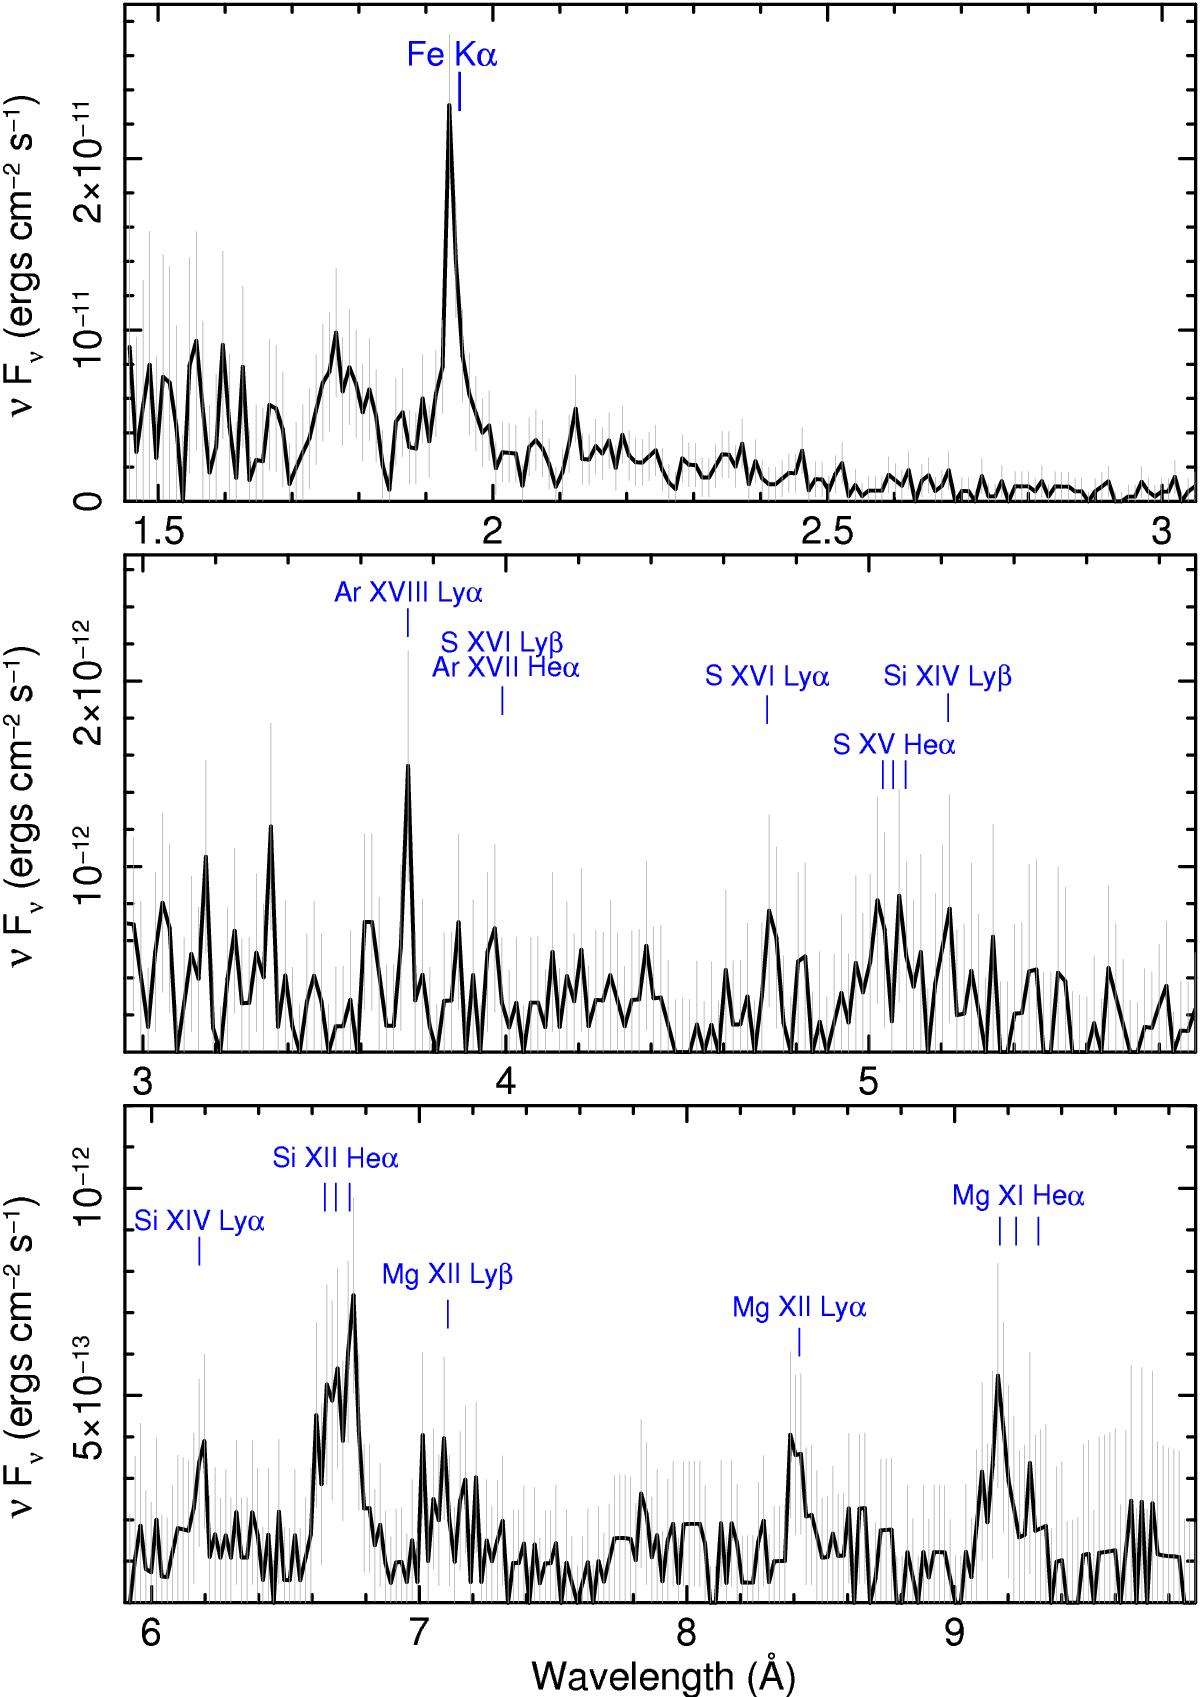
Chandra-HETG spectrum of NGC 7582, shown vs. the rest frame wavelength (increasing in λfrom the top to the lower panel). The spectra are binned at the FWHM resolution for both the HEG (Δλ = 0.01 Å) and the MEG (Δλ = 0.02 Å). The spectra have been folded against a power-law model with Γ = 2. The top panel shows the HEG spectrum in the 1.45−3 Å range (corresponding to ~ 4−8.5 keV) covering the Fe Kα emission line. The middle and lower panels are from the MEG grating. The strongest emission features (labeled in blue) are due to argon (at ~ 3.7 Å), sulphur (at ~ 5 Å range), silicon, with the prominent He-like triplet at ~ 6.6 Å, and magnesium (in the ~ 7−9 Å range). The broadband spectrum is line dominated with an extremely weak continuum emission, which emerges only below ~ 2.5 Å (i.e., at E ≳ 5 keV).
Current usage metrics show cumulative count of Article Views (full-text article views including HTML views, PDF and ePub downloads, according to the available data) and Abstracts Views on Vision4Press platform.
Data correspond to usage on the plateform after 2015. The current usage metrics is available 48-96 hours after online publication and is updated daily on week days.
Initial download of the metrics may take a while.