Fig. 4
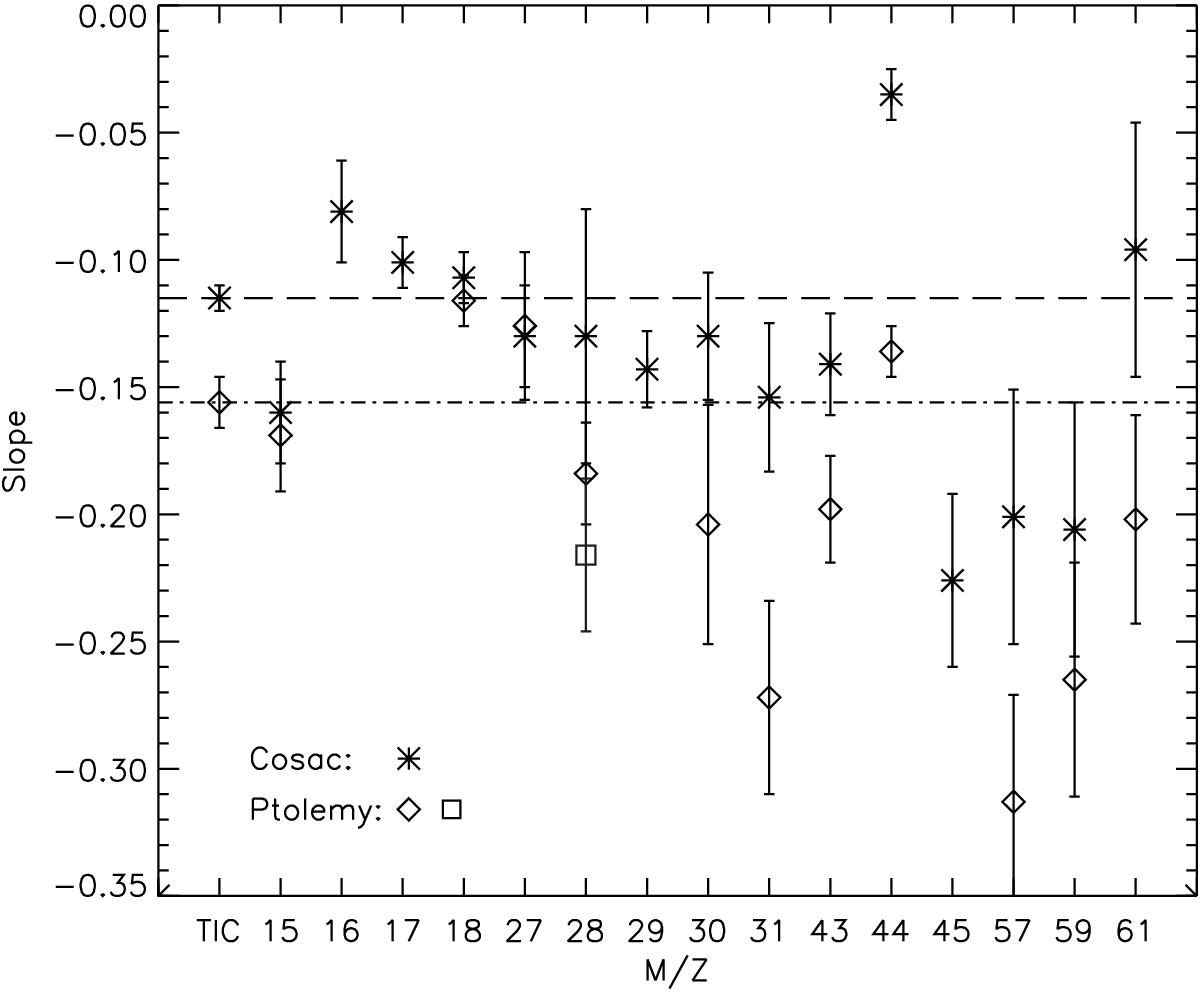
Slopes of fits for the individual ion species investigated; asterisks: COSAC (data listed in Table 3), diamonds: Ptolemy, square: Ptolemy m/z 28 corrected for CO2 fragmentation. The error bars display 1σ uncertainties for the slopes derived from fitting exponentials to the data, taking into account uncertainties in instrumental background. The horizontal lines indicate the values for the total ion counts (TIC) for COSAC (long dashes) and Ptolemy (dash-dots).
Current usage metrics show cumulative count of Article Views (full-text article views including HTML views, PDF and ePub downloads, according to the available data) and Abstracts Views on Vision4Press platform.
Data correspond to usage on the plateform after 2015. The current usage metrics is available 48-96 hours after online publication and is updated daily on week days.
Initial download of the metrics may take a while.