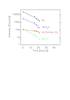
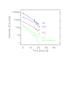
Fig. 3

Left: COSAC measurements #1 to 5 (Table 1) corrected for instrumental backgound. Spectrum #0 was used for background correction. The noise is about 10 ion counts per integer m/z bin. Right: same for Ptolemy. Corrections for instrumental background and CO2 fragmentation were applied (see text for details). Exponential slopes were fitted to the data (Table 3). As for Fig. 2, the time axis is set to zero at Philae’s touchdown.
Current usage metrics show cumulative count of Article Views (full-text article views including HTML views, PDF and ePub downloads, according to the available data) and Abstracts Views on Vision4Press platform.
Data correspond to usage on the plateform after 2015. The current usage metrics is available 48-96 hours after online publication and is updated daily on week days.
Initial download of the metrics may take a while.