Fig. 2
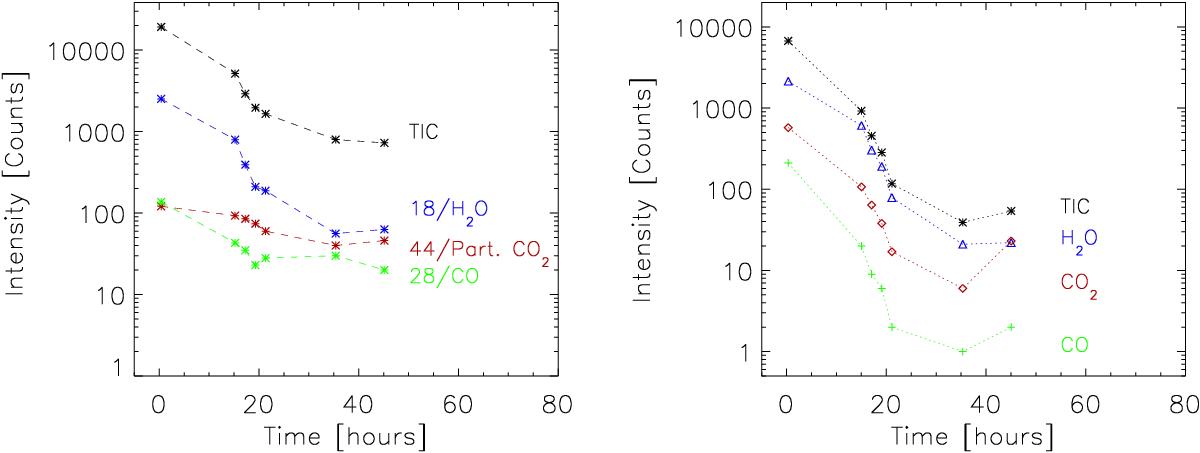
Left: temporal behaviour of ion species with m/z 18 (H2O), 28 (CO), 44 (partially CO2) and total ion counts (TIC), respectively, derived from the seven COSAC spectra (raw counts, not corrected for instrumental background). Right: ptolemy data taken from Morse et al. (2015, their Table 3, corrected for hydrogen abstraction, a feature of the ion trap employed in Ptolemy). The time axis is set to zero at Philae’s touchdown on 12 November 2014, 15:34:04 UTC (see text for details).
Current usage metrics show cumulative count of Article Views (full-text article views including HTML views, PDF and ePub downloads, according to the available data) and Abstracts Views on Vision4Press platform.
Data correspond to usage on the plateform after 2015. The current usage metrics is available 48-96 hours after online publication and is updated daily on week days.
Initial download of the metrics may take a while.