Fig. 8
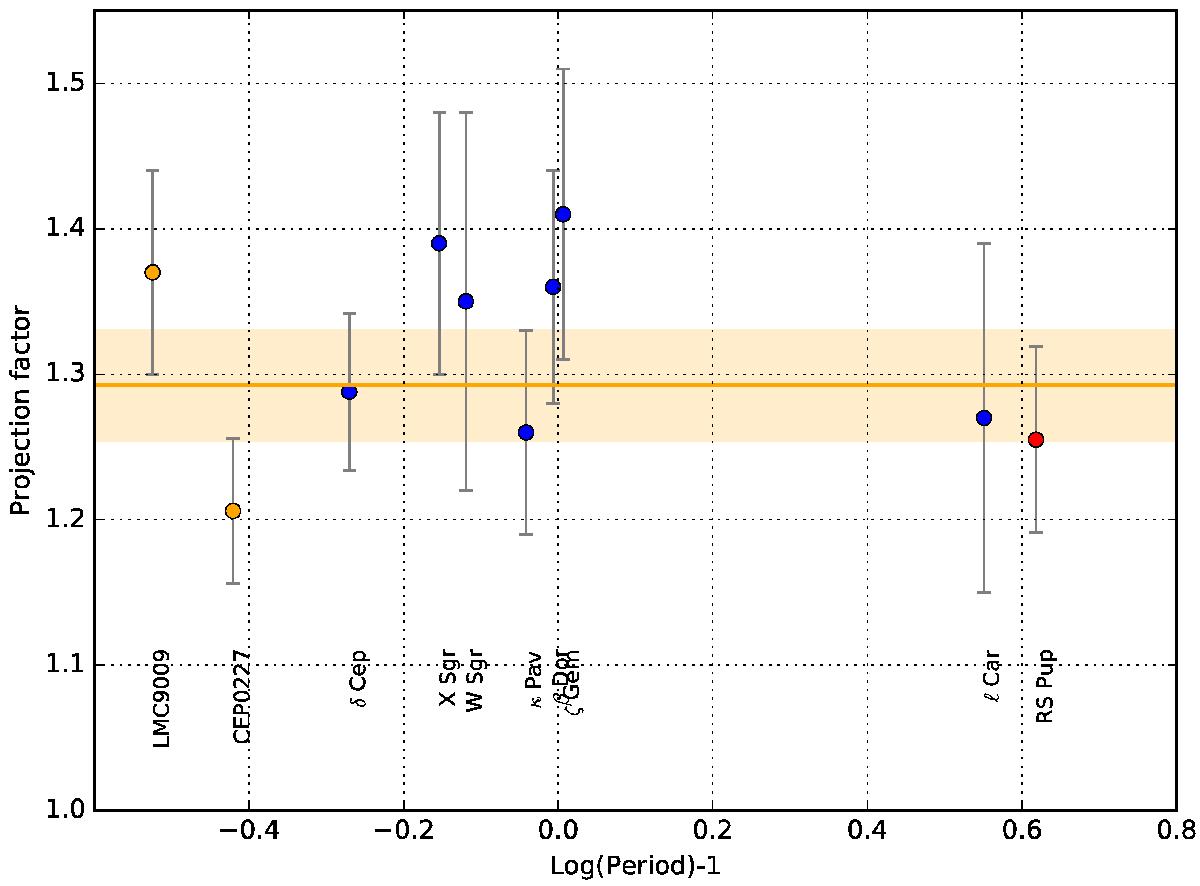
Distribution of the measured p-factors of Cepheids with better than 10% relative accuracy. The references for the different measurements (except RS Pup) are listed in Breitfelder et al. (2016). The blue points use HST-FGS distances (Benedict et al. 2002, 2007), the orange points are the LMC eclipsing Cepheids (Pilecki et al. 2013; Gieren et al. 2015). The solid line and orange shaded area represent the weighted average ![]() .
.
Current usage metrics show cumulative count of Article Views (full-text article views including HTML views, PDF and ePub downloads, according to the available data) and Abstracts Views on Vision4Press platform.
Data correspond to usage on the plateform after 2015. The current usage metrics is available 48-96 hours after online publication and is updated daily on week days.
Initial download of the metrics may take a while.