Fig. 3
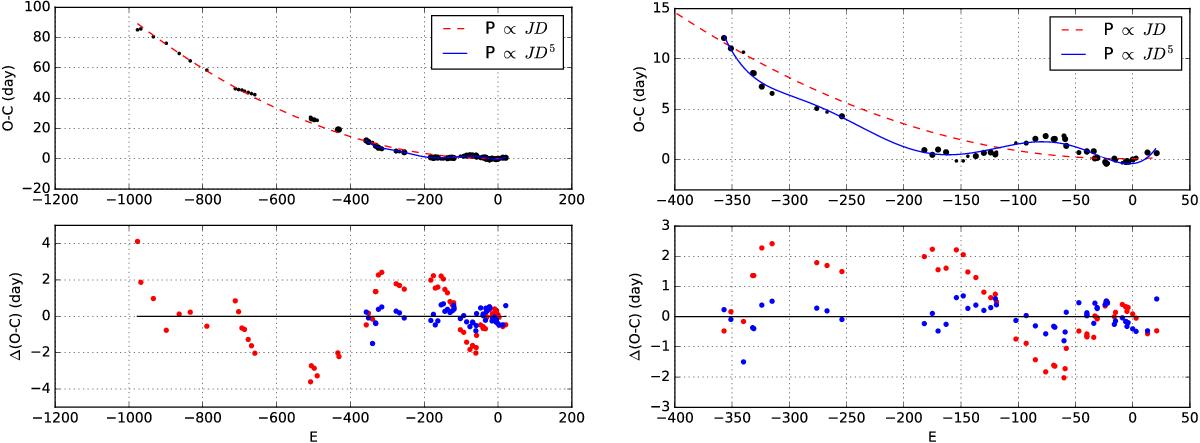
Left column: O−C diagram for RS Pup (top panel) and residuals of the model (bottom panel) for a linear period variation (red dashed line and points) and a fifth-degree polynomial function (blue solid line and points). The size of the black points in the upper panel is proportional to their weight in the fit (Table A.1). Right column: enlargement of the O−C diagram covering the last 400 pulsation cycles of RS Pup.
Current usage metrics show cumulative count of Article Views (full-text article views including HTML views, PDF and ePub downloads, according to the available data) and Abstracts Views on Vision4Press platform.
Data correspond to usage on the plateform after 2015. The current usage metrics is available 48-96 hours after online publication and is updated daily on week days.
Initial download of the metrics may take a while.