Fig. 2
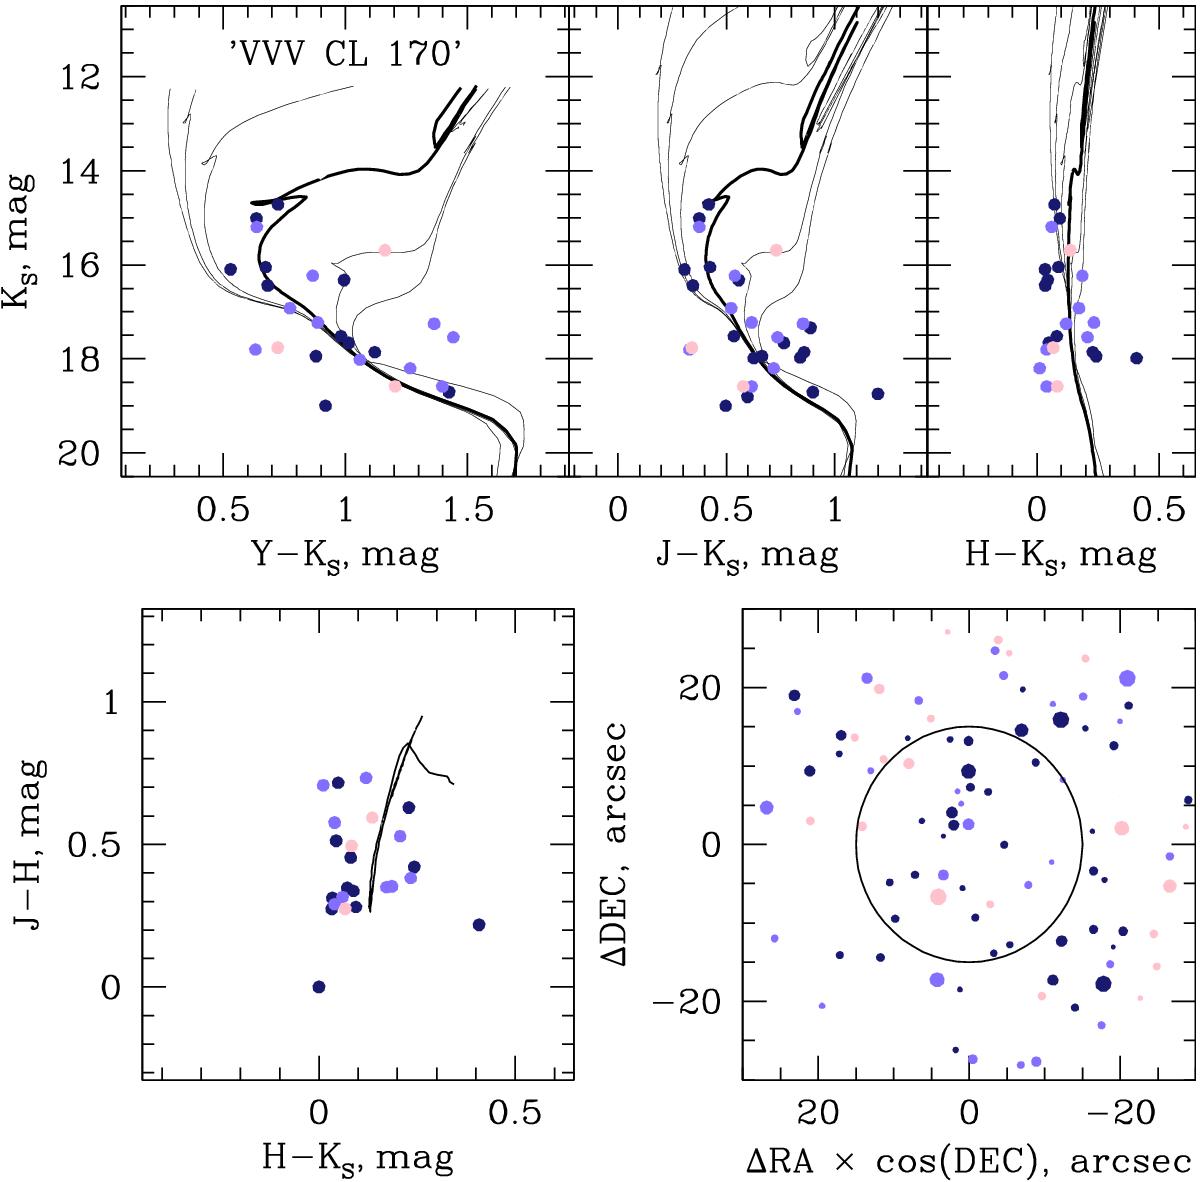
Top: color–magnitude diagrams of the cluster VVV CC 170 (top). Solar abundance theoretical isochrones for ages log(t/1 yr) = 7.5, 8.0, 8.5, 9.0, 9.5, and 10.0 from Bressan et al. (2012) are also shown. Bottom left: color–color diagram. Only the log(t/1 yr) = 9.0 isochrone is drawn for simplicity. Bottom right: a map of the cluster candidate. The black circle indicates the object size. On all panels the cluster candidate membership probabilities are color coded: dark blue implies ≥75%, light blue is 50%, and pink indicates ≤25%, respectively. Similar plots for the other cluster candidates are shown in Fig. B.1.
Current usage metrics show cumulative count of Article Views (full-text article views including HTML views, PDF and ePub downloads, according to the available data) and Abstracts Views on Vision4Press platform.
Data correspond to usage on the plateform after 2015. The current usage metrics is available 48-96 hours after online publication and is updated daily on week days.
Initial download of the metrics may take a while.