Free Access
Fig. 9
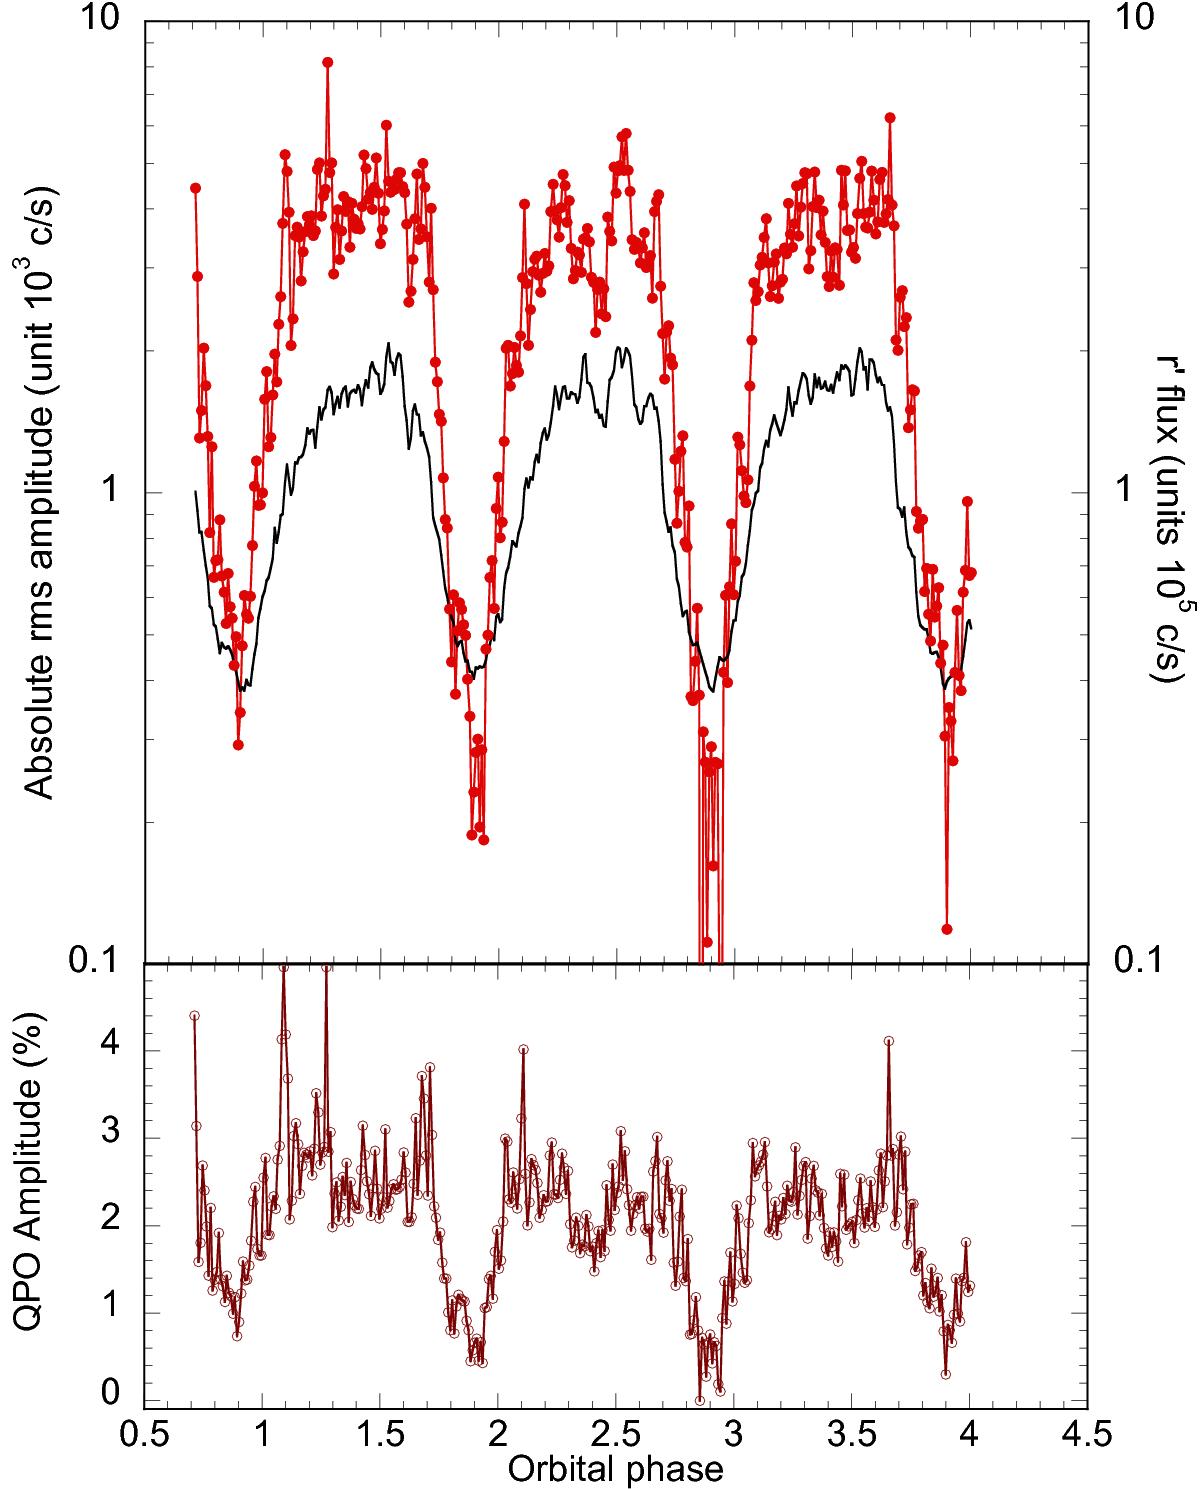
Top: absolute QPO rms amplitude versus orbital phase computed for the 52.4 s data segments in the r′ filter, shown in logarithmic scale (in red). The r′ light curve (in black) is also superposed, with the scale given at right. Bottom: fractional QPO rms amplitude (in per cent) versus orbital phase.
Current usage metrics show cumulative count of Article Views (full-text article views including HTML views, PDF and ePub downloads, according to the available data) and Abstracts Views on Vision4Press platform.
Data correspond to usage on the plateform after 2015. The current usage metrics is available 48-96 hours after online publication and is updated daily on week days.
Initial download of the metrics may take a while.