Free Access
Fig. 8
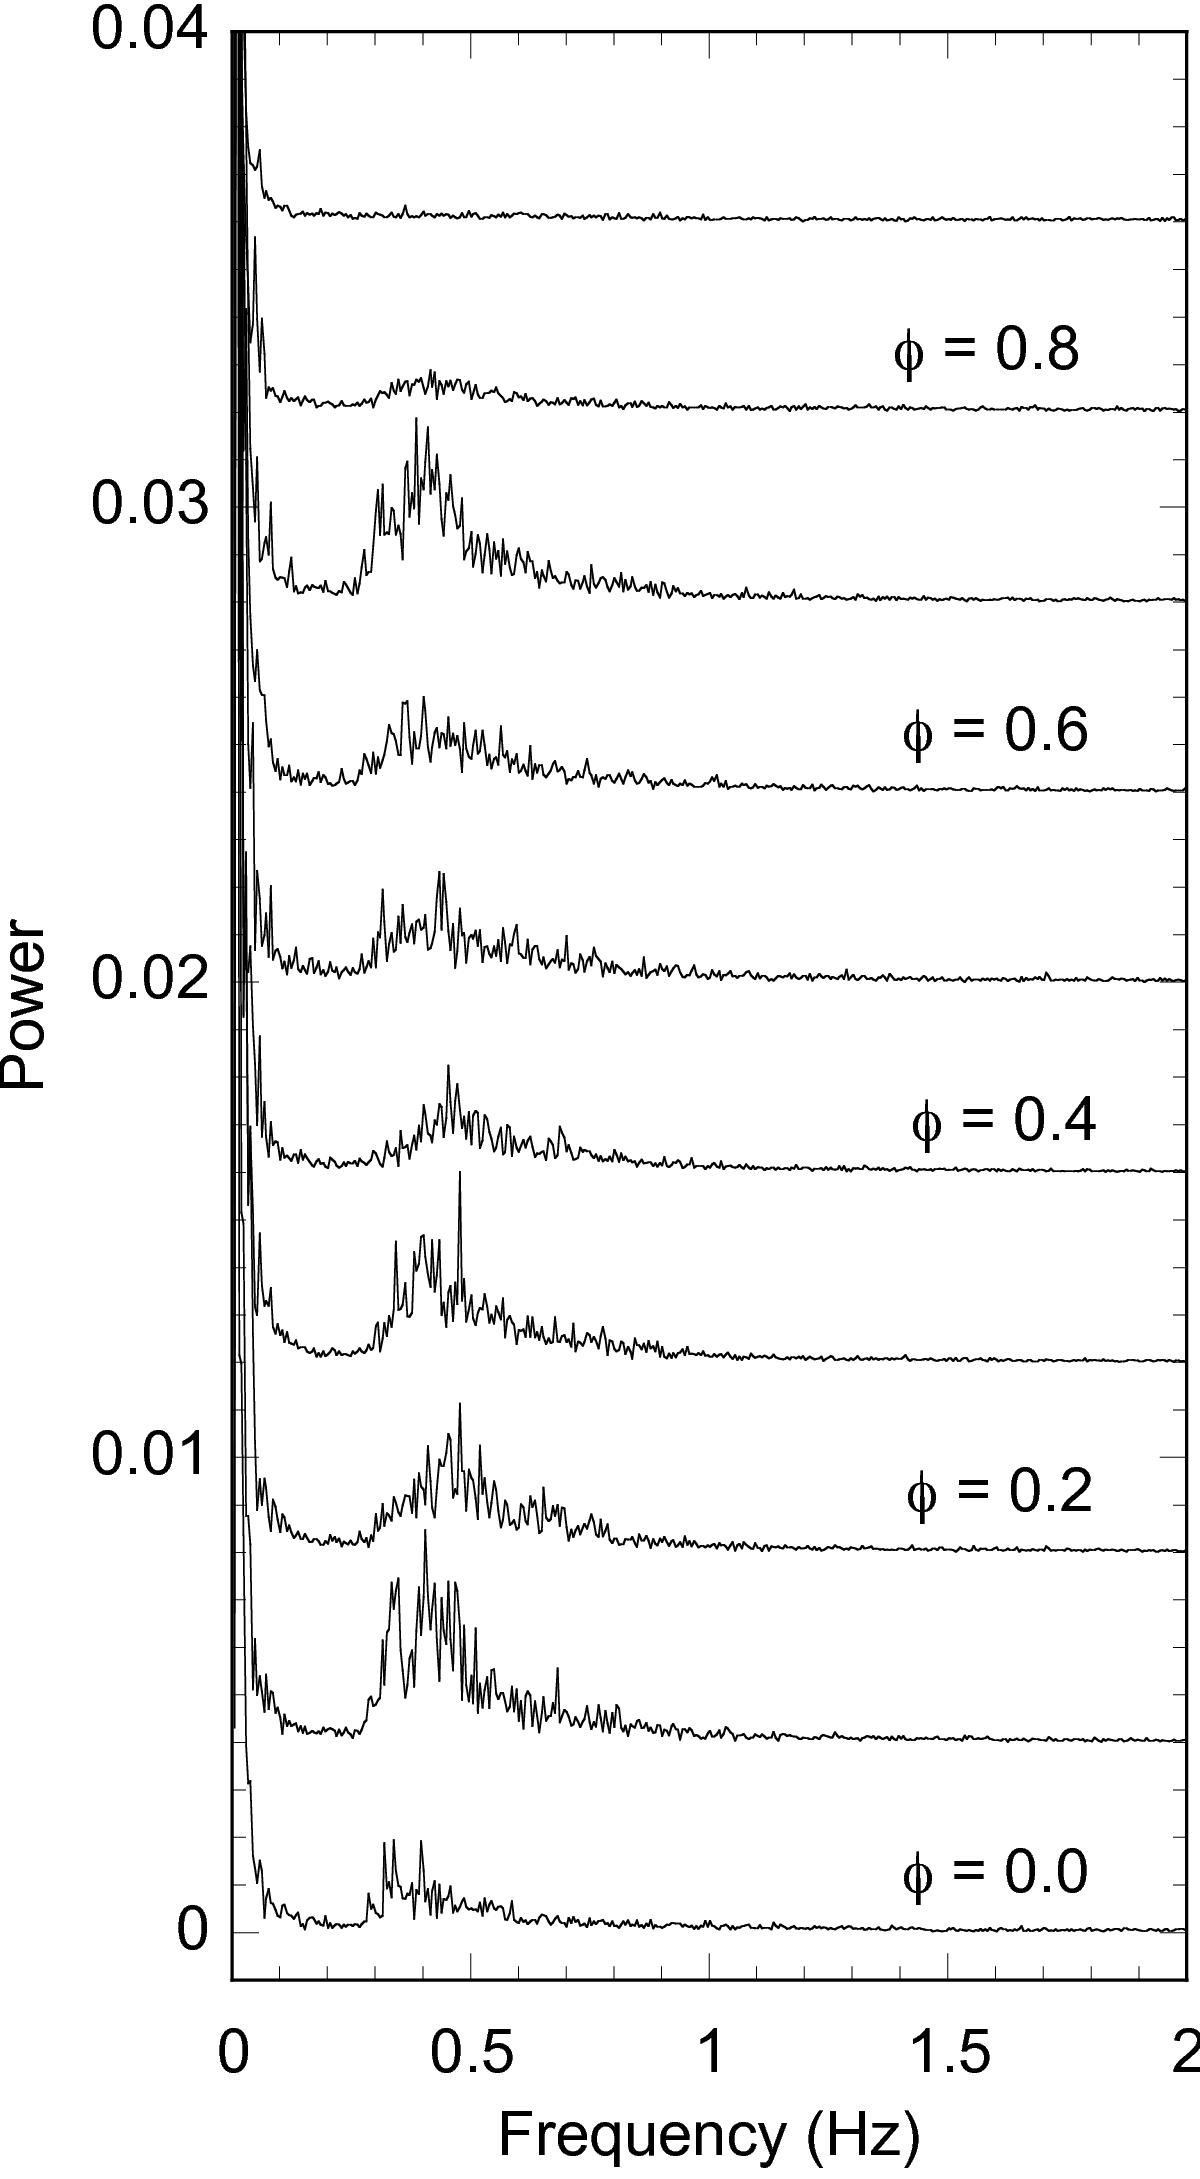
Phase-resolved power spectra for the r′ light curve in the range (0−2) Hz, built from individual 210 s FFTs. Phase increases from bottom to top by steps of 0.1 in phase. Power is in units of rms2 Hz-1. Each phase spectrum is shifted vertically by a constant value of 0.004.
Current usage metrics show cumulative count of Article Views (full-text article views including HTML views, PDF and ePub downloads, according to the available data) and Abstracts Views on Vision4Press platform.
Data correspond to usage on the plateform after 2015. The current usage metrics is available 48-96 hours after online publication and is updated daily on week days.
Initial download of the metrics may take a while.