Fig. 6
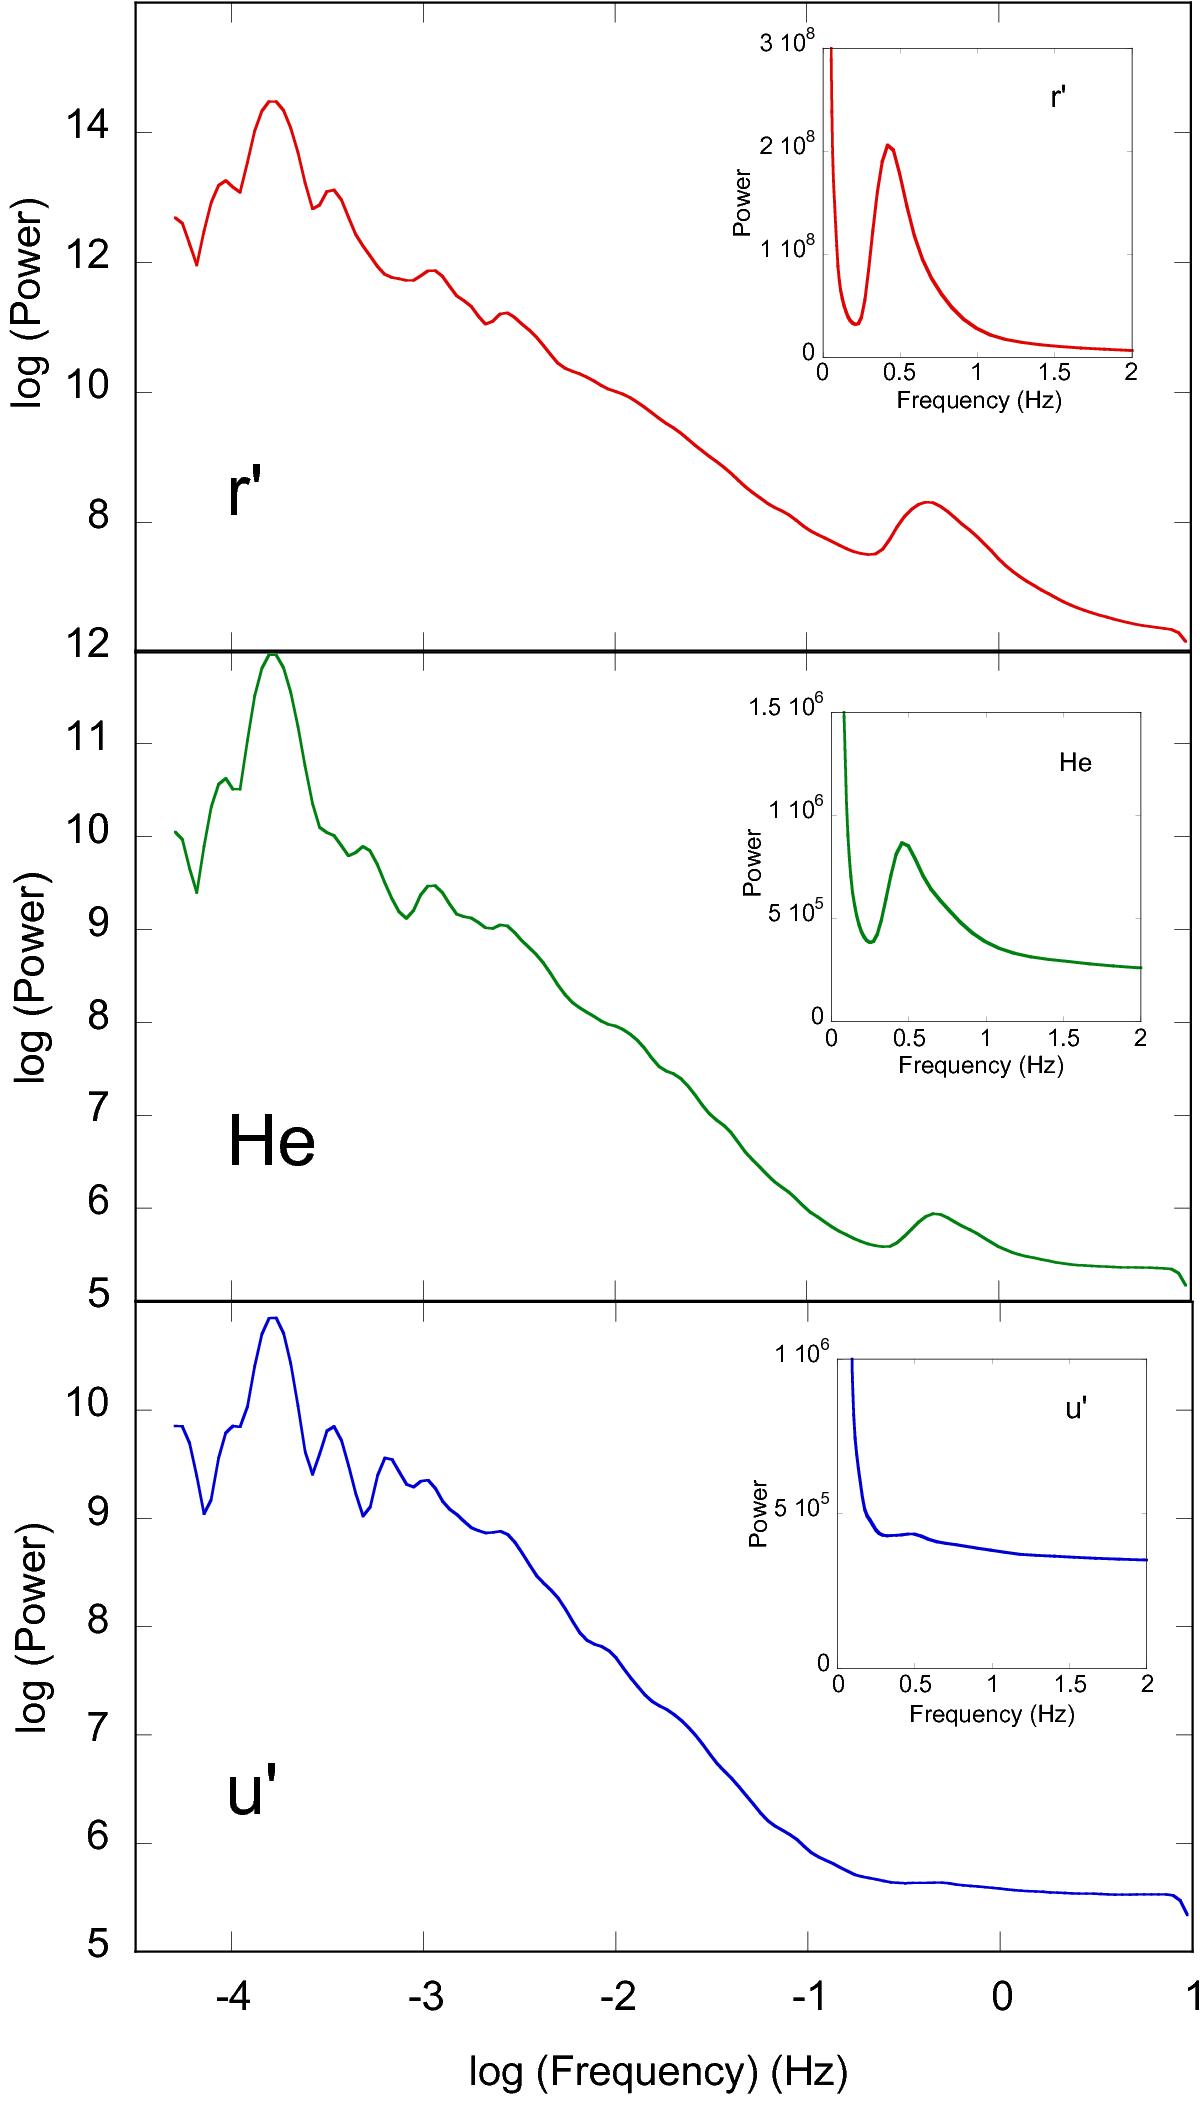
Main frame: mean wavelet spectra of the light curves for the three filters (top: r′, middle: He, bottom: u′) shown in logarithmic scale in the range (5 × 10⁻⁵ − 10) Hz. The peak at 1.6 × 10⁻⁴ Hz corresponds to the orbital frequency and some power is also visible in the range (10-3 − 10-2) Hz. Insets: subset in the range (0−2) Hz is shown in linear scale to emphasise the fast QPOs.
Current usage metrics show cumulative count of Article Views (full-text article views including HTML views, PDF and ePub downloads, according to the available data) and Abstracts Views on Vision4Press platform.
Data correspond to usage on the plateform after 2015. The current usage metrics is available 48-96 hours after online publication and is updated daily on week days.
Initial download of the metrics may take a while.