Fig. 5
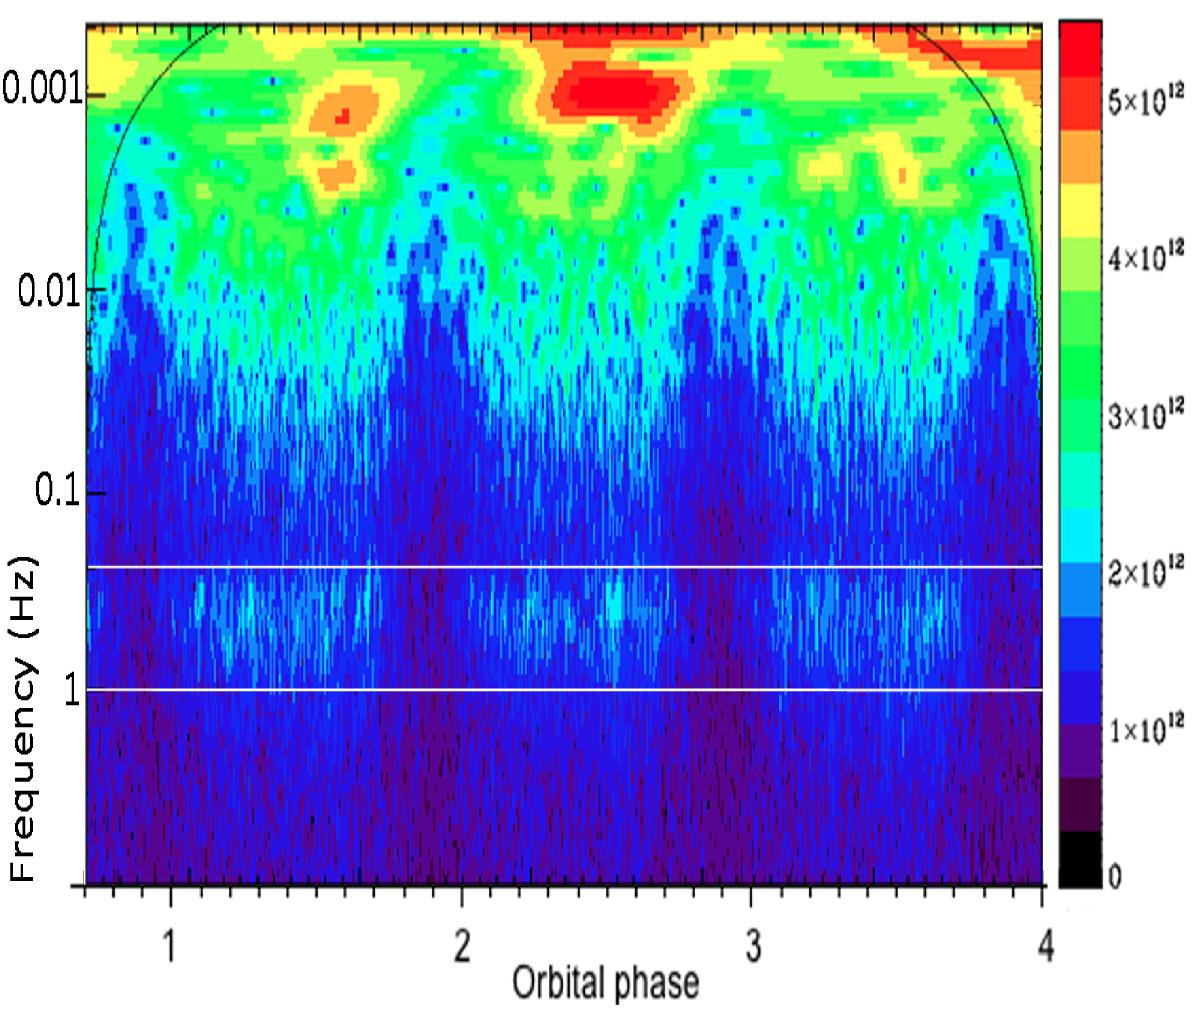
Wavelet transform (scalogram) of the r′ filter light curve, mapping the time-frequency evolution of the signal. Significant QPO amplitude is visible around ~2 s (delimitated by horizontal white lines) but variability is also present in the range ~100 s. High flaring activity is also visible around 1000 s in the second orbital cycle. The thin black line at the top of the figure delimits the cone of influence below which the information is fully usable.
Current usage metrics show cumulative count of Article Views (full-text article views including HTML views, PDF and ePub downloads, according to the available data) and Abstracts Views on Vision4Press platform.
Data correspond to usage on the plateform after 2015. The current usage metrics is available 48-96 hours after online publication and is updated daily on week days.
Initial download of the metrics may take a while.